

Question: #DIRECTIONS Create an R script that creates 4 plots similar to those below. Modify, delete, change or add features: color, labels, legends, subtitles, bin size
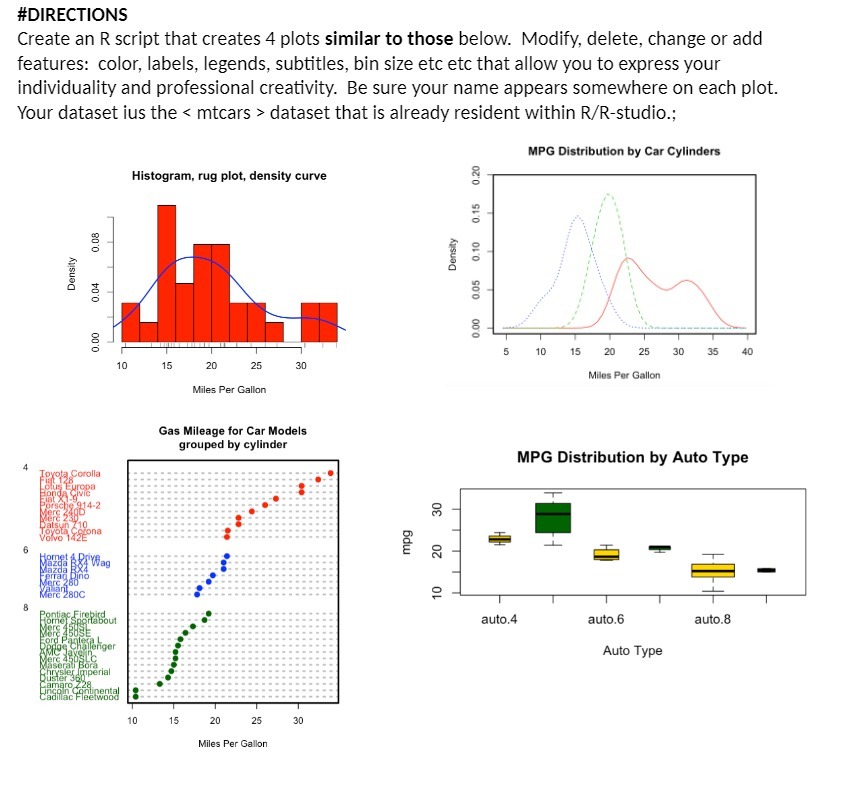
#DIRECTIONS Create an R script that creates 4 plots similar to those below. Modify, delete, change or add features: color, labels, legends, subtitles, bin size etc etc that allow you to express your individuality and professional creativity. Be sure your name appears somewhere on each plot. Your dataset ius the dataset that is already resident within R/R-studio.; MPG Distribution by Car Cylinders Histogram, rug plot, density curve 0.20 0.15 0.08 0.10 Density Density 0.05 0.04 0.00 0.00 5 10 15 20 25 30 35 40 10 15 20 25 30 Miles Per Gallon Miles Per Gallon Gas Mileage for Car Models grouped by cylinder MPG Distribution by Auto Type Toyota Corolla plus Europi Datsun mpg 636 4 Wag Here 280C Howat sport bout auto.4 auto.6 auto.8 Penge Challenger Auto Type Duster 360' Prominental Cadillac Fleetwood 10 15 20 25 30 Miles Per Gallon
Step by Step Solution
There are 3 Steps involved in it

Get step-by-step solutions from verified subject matter experts