

Question: Directions: For the dataset presented on the previous page, complete both the horizontal and the vertical axes (by filling in numbers appropriately) of the histogram
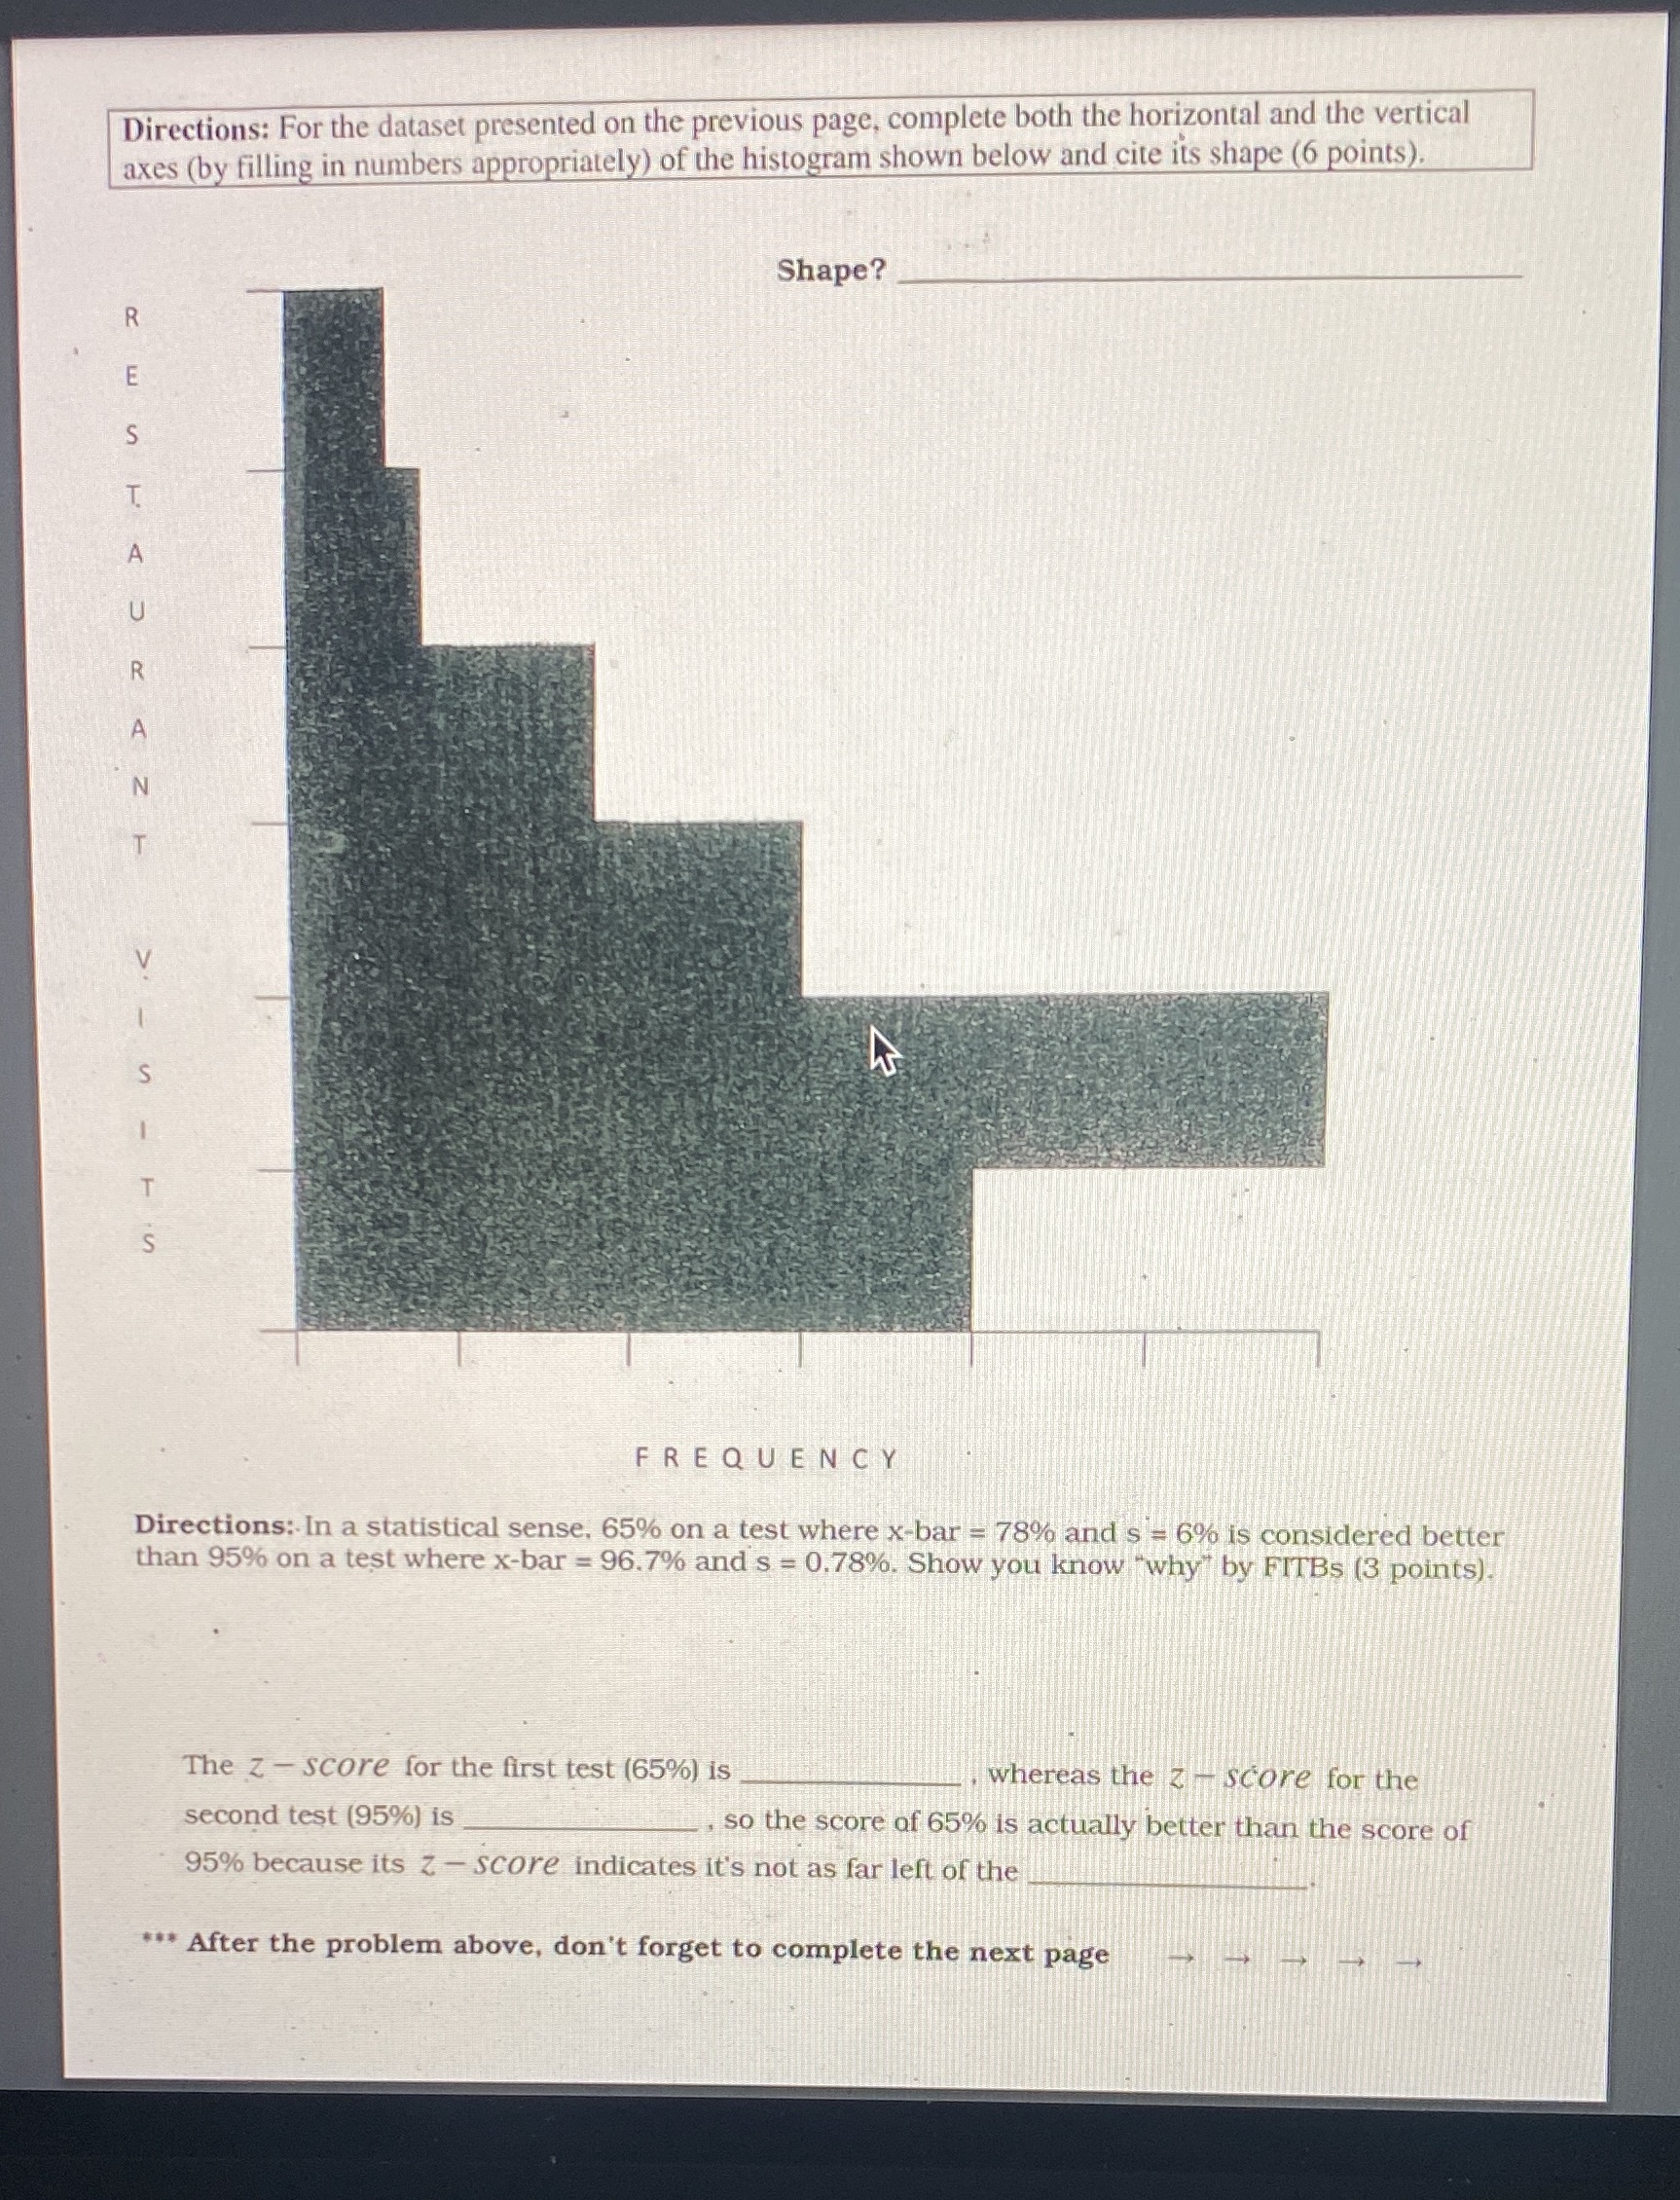
Directions: For the dataset presented on the previous page, complete both the horizontal and the vertical axes (by filling in numbers appropriately) of the histogram shown below and cite its shape (6 points). Shape? H Z D DCDH - 6 -. FREQUENCY Directions: In a statistical sense, 65% on a test where x-bar = 78% and s = 6% is considered better than 95% on a test where x-bar = 96.7% and s = 0.78%. Show you know "why" by FITBs (3 points). The z - score for the first test (65%) is whereas the z score for the second test (95%) is so the score of 65% is actually better than the score of 95% because its z - score indicates it's not as far left of the * After the problem above, don't forget to complete the next page
Step by Step Solution
There are 3 Steps involved in it

Get step-by-step solutions from verified subject matter experts