

Question: Directions: Show all your work. Indicate clearly the methods you use, because you will be scored on the correctness of your methods as well as
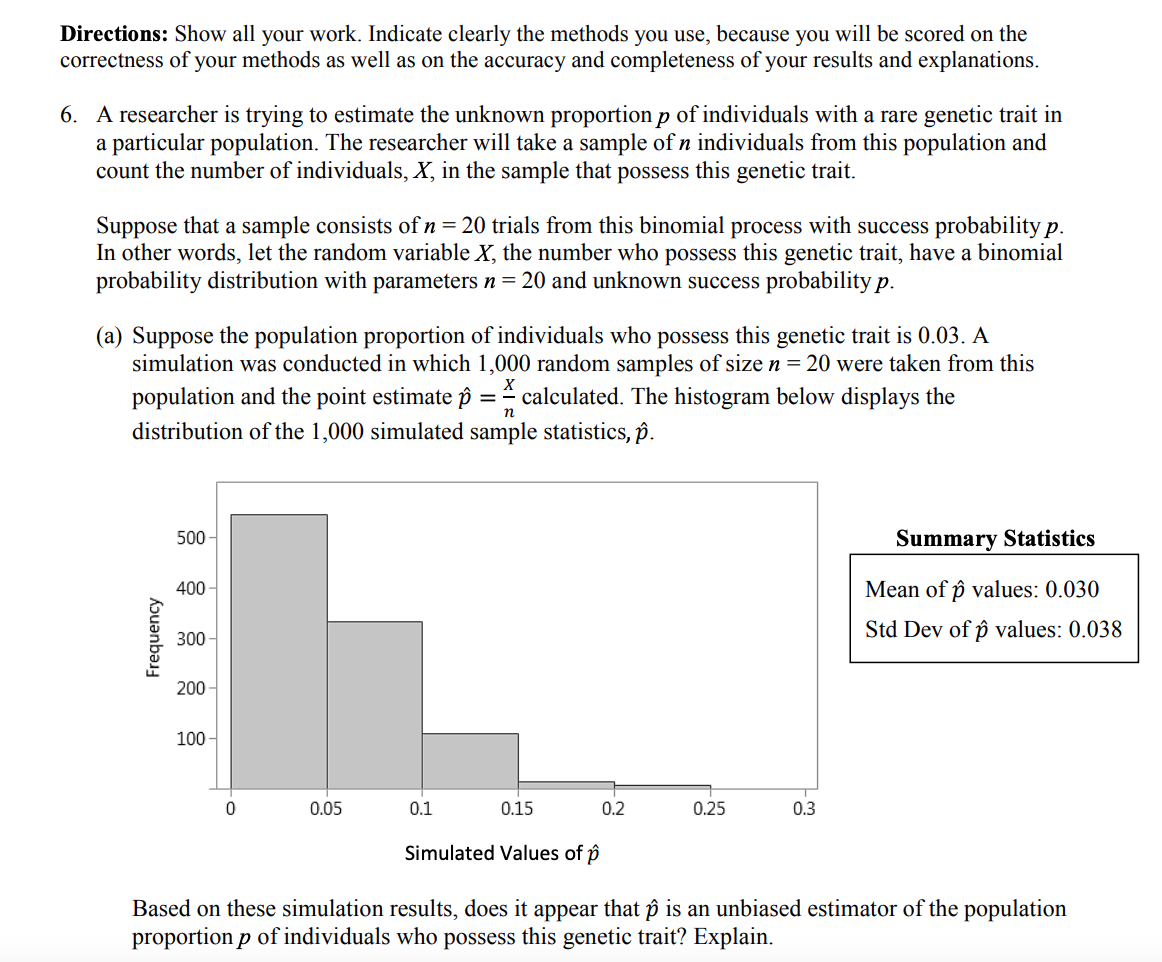
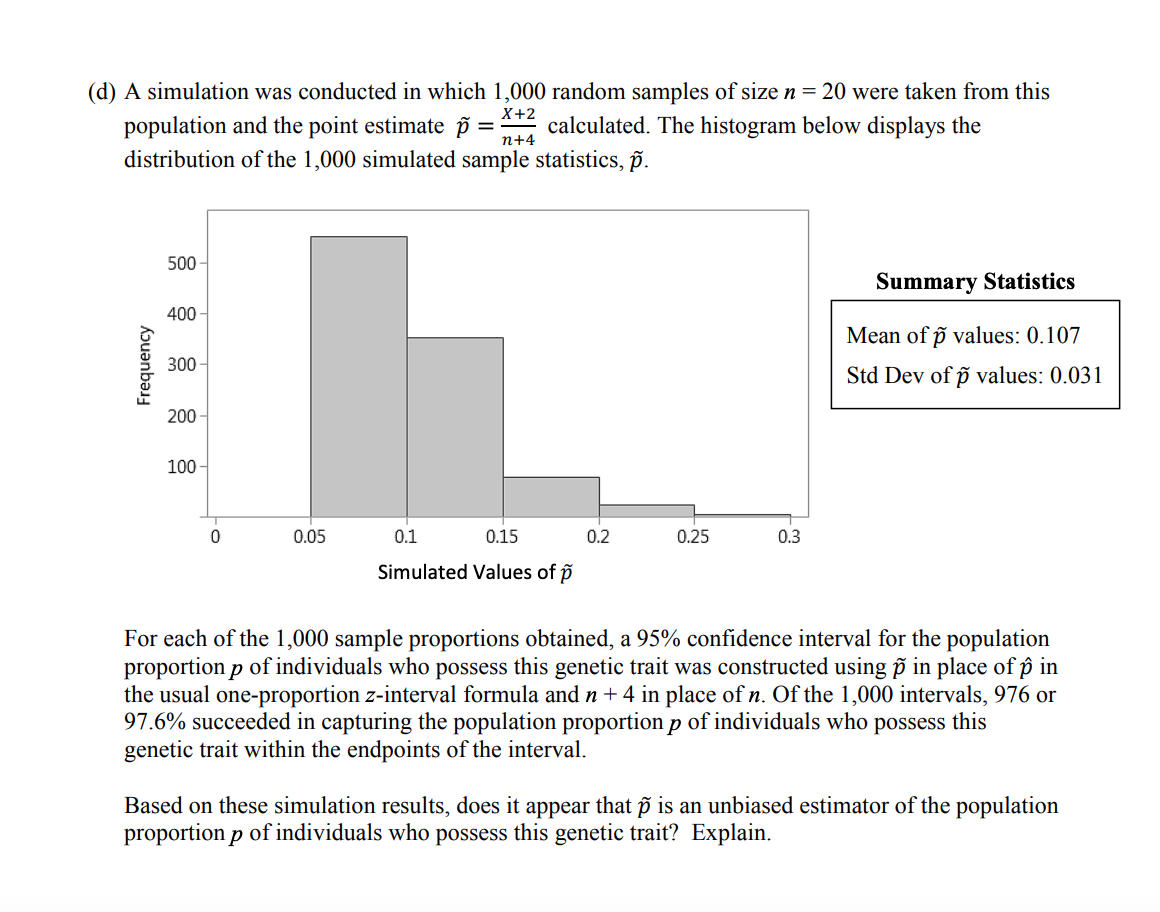
Directions: Show all your work. Indicate clearly the methods you use, because you will be scored on the correctness of your methods as well as on the accuracy and completeness of your results and explanations. 6. A researcher is trying to estimate the unknown proportion p of individuals with a rare genetic trait in a particular population. The researcher will take a sample of individuals from this population and count the number of individuals, X, in the sample that possess this genetic trait. Suppose that a sample consists of n = 20 trials from this binomial process with success probability p. In other words, let the random variable X, the number who possess this genetic trait, have a binomial probability distribution with parameters n = 20 and unknown success probability p. (a) Suppose the population proportion of individuals who possess this genetic trait is 0.03. A simulation was conducted in which 1,000 random samples of size n = 20 were taken from this population and the point estimate p = E calculated. The histogram below displays the distribution of the 1,000 simulated sample statistics, p. 500 - Summary Statistics 5, 400 Mean of p values: 0.030 g_ 300 - Std Dev of p values: 0.038 = 200 100 | 0 0.[I]5 0.1 0.I15 0.I2 0.25 0.I3 Simulated Values of p Based on these simulation results, does it appear that p is an unbiased estimator of the population proportion p of individuals who possess this genetic trait? Explain. (b) For each of the 1,000 sample proportions obtained in part (a), a 95% confidence interval for the population proportion p of individuals who possess this genetic trait was constructed using the usual one-proportion z-interval formula. Of the 1,000 intervals, 469 or 46.9% succeeded in capturing the population proportion p of individuals who possess this genetic trait within the endpoints of the interval. Explain why the proportion of intervals in the simulation that succeeded in capturing the parameter p was much less than 95%. Another estimator for p that can provide a statistical advantage over the conventional estimator p in certain situations is the following: X+2 n+4 = (c) Carry out the calculations below to investigate the relationship between p and p. (1) Suppose that the sample results in 5 individuals who possess this genetic trait among the 20 trials. Determine the values of p and p. (i1) Suppose now that the sample results in 12 successes among the 20 trials. Determine the values of p and P. (111) Are there any sample results for which the values of p and p would be the same? Justify your answer. (d) A simulation was conducted in which 1,000 random samples of size n = 20 were taken from this population and the point estimate p = % calculated. The histogram below displays the distribution of the 1,000 simulated sample statistics, p. 500 Summary Statistics 400 - Mean of p values: 0.107 a s A Std Dev of p values: 0.031 "~ 200 100+ d 0.05 01 0'.15 0.2 0.I25 0.I3 Simulated Values of p For each of the 1,000 sample proportions obtained, a 95% confidence interval for the population proportion p of individuals who possess this genetic trait was constructed using P in place of p in the usual one-proportion z-interval formula and n + 4 in place of n. Of the 1,000 intervals, 976 or 97.6% succeeded in capturing the population proportion p of individuals who possess this genetic trait within the endpoints of the interval. Based on these simulation results, does it appear that p is an unbiased estimator of the population proportion p of individuals who possess this genetic trait? Explain. (e) Based on comparing the summary statistics for the simulation results in parts (a) and (d), state a statistical advantage of the estimator p. (f) Based on comparing the summary statistics for the simulation results in parts (a) and (d), state a statistical advantage of the estimator . Explain why this statistical advantage makes sense, given that the new statistic P is calculated by adding 2 to the numerator and 4 to the denominator of p
Step by Step Solution
There are 3 Steps involved in it

Get step-by-step solutions from verified subject matter experts