

Question: Directions: Show all your work. Indicate clearly the methods you use, because you will be graded on the correctness of your methods as well as
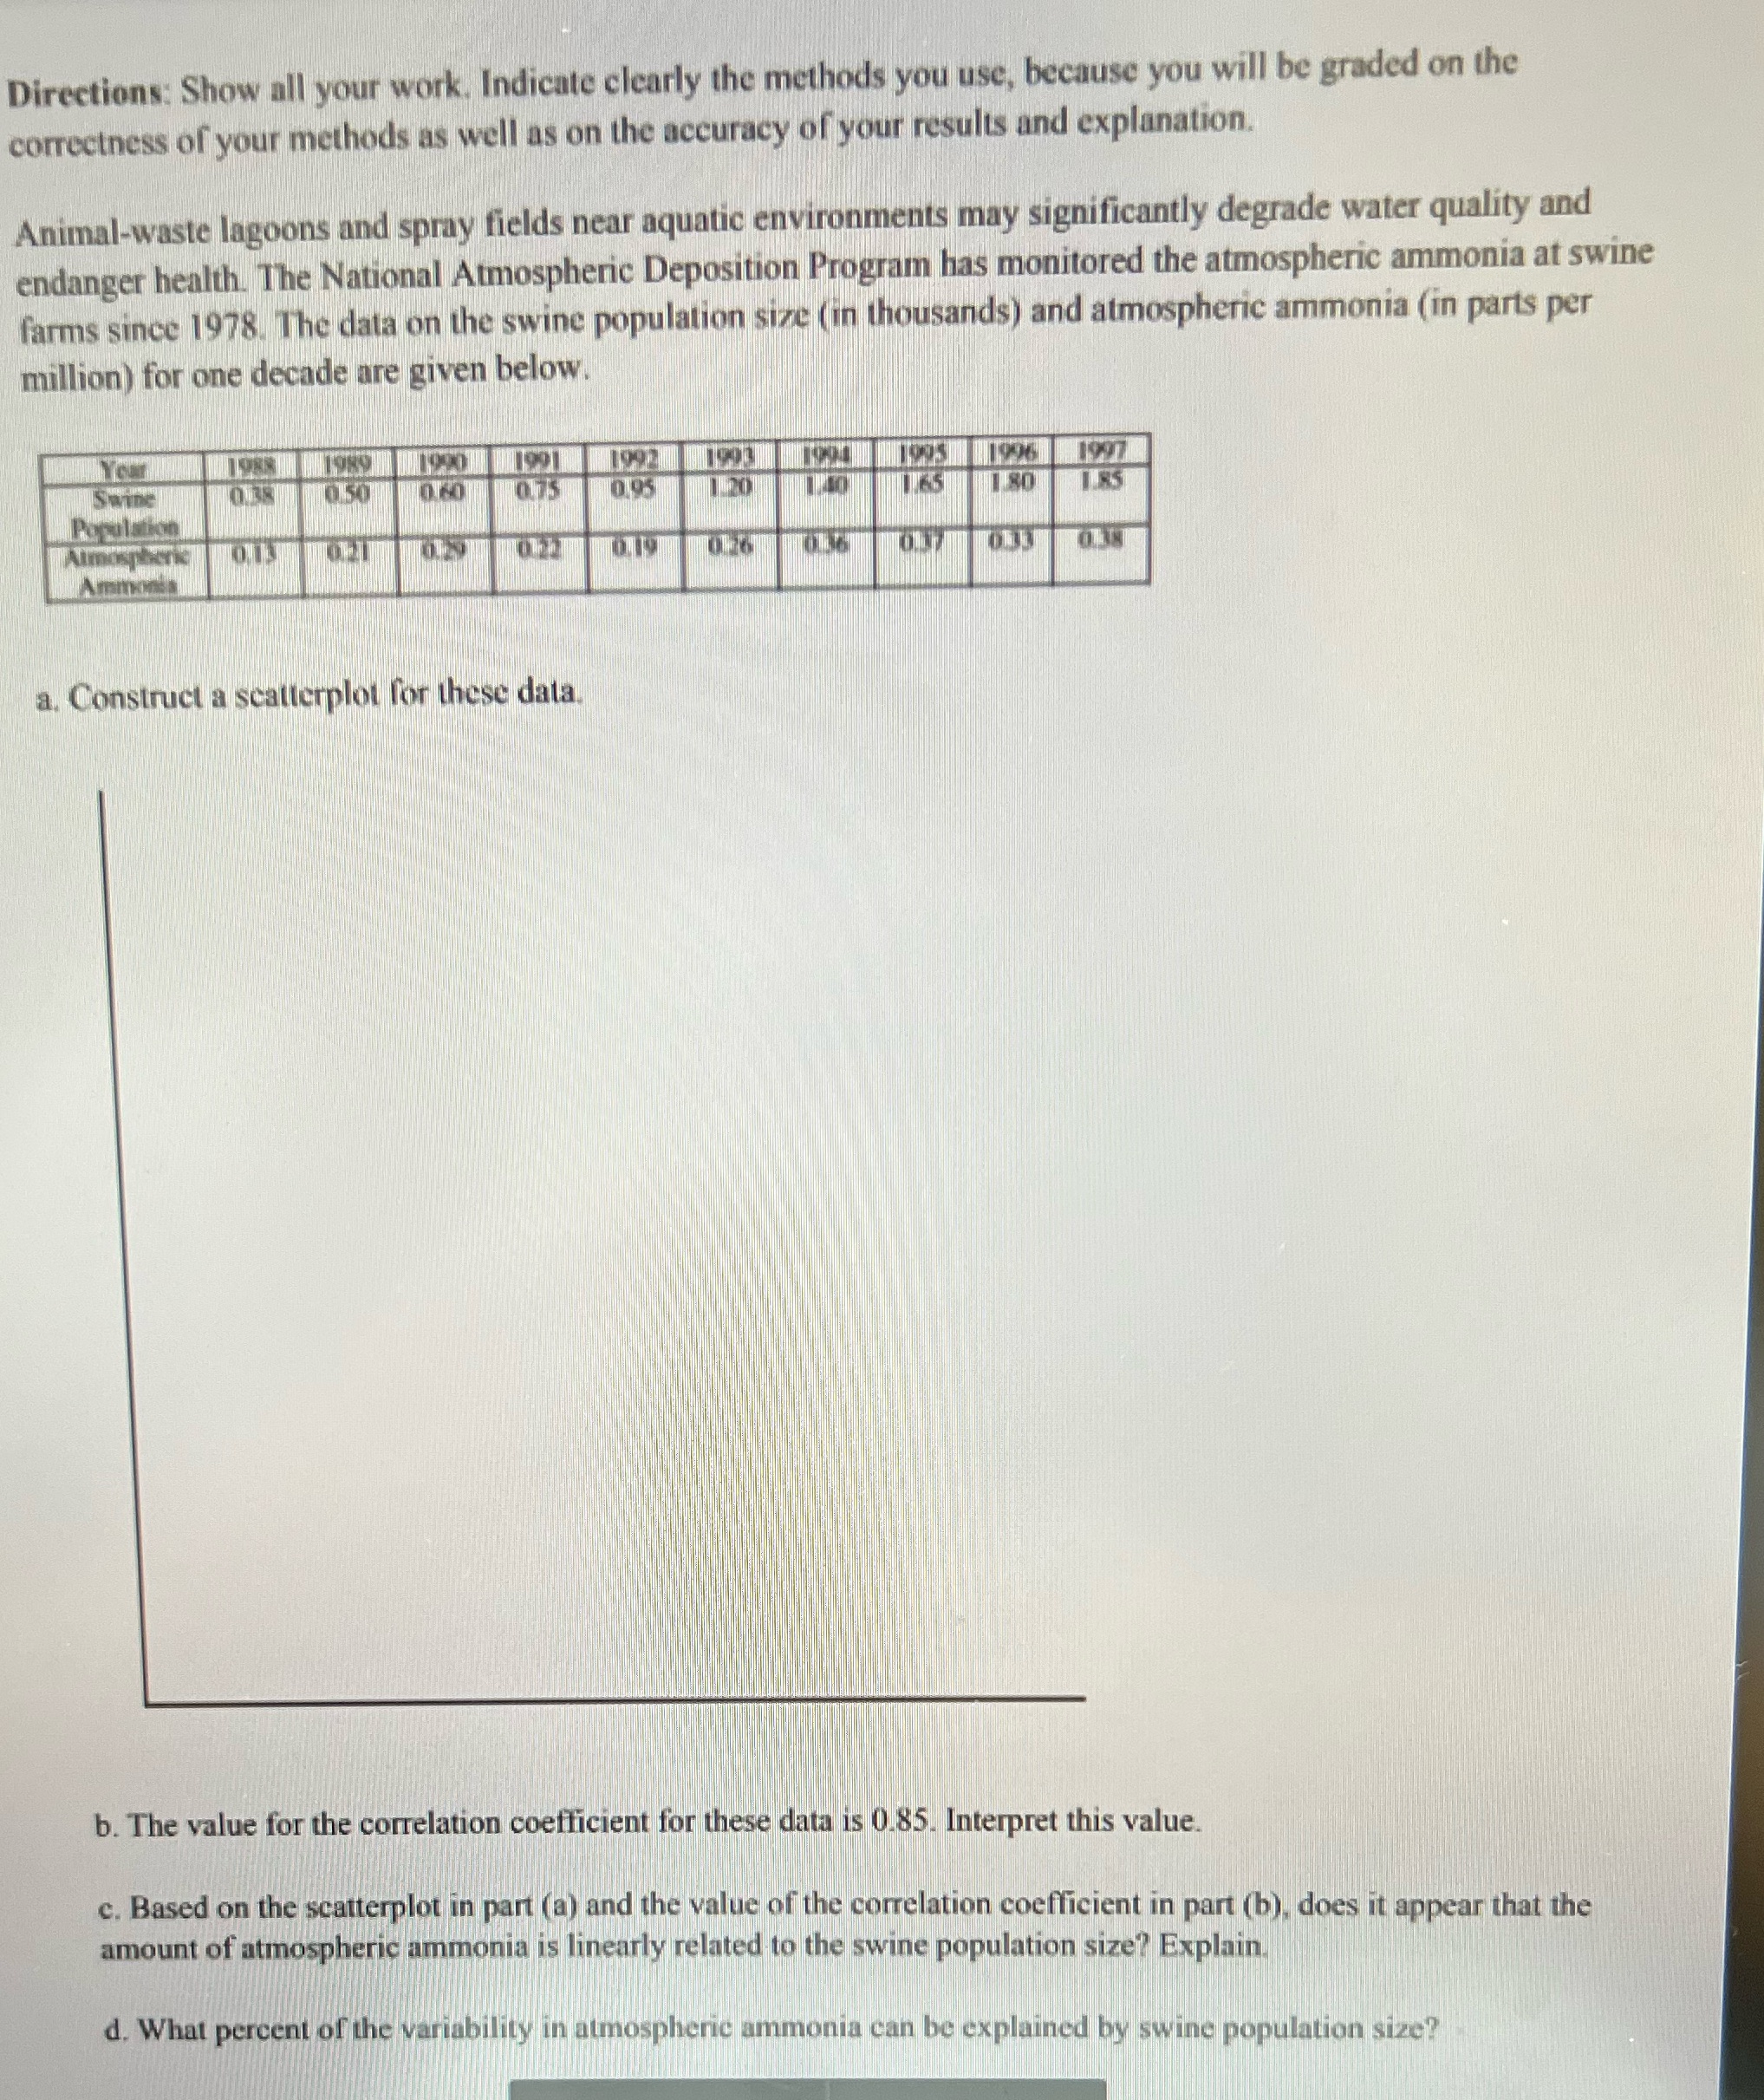
Directions: Show all your work. Indicate clearly the methods you use, because you will be graded on the correctness of your methods as well as on the accuracy of your results and explanation. Animal-waste lagoons and spray fields near aquatic environments may significantly degrade water quality and endanger health. The National Atmospheric Deposition Program has monitored the atmospheric ammonia at swine farms since 1978. The data on the swine population size (in thousands) and atmospheric ammonia (in parts per million) for one decade are given below. 1992 1907 Swine 0.95 Population Atmosphere a. Construct a scatterplot for these data. b. The value for the correlation coefficient for these data is 0.85. Interpret this value. c. Based on the scatterplot in part (a) and the value of the correlation coefficient in part (b), does it appear that the amount of atmospheric ammonia is linearly related to the swine population size? Explain. d. What percent of the variability in atmospheric ammonia can be explained by swine population size
Step by Step Solution
There are 3 Steps involved in it

Get step-by-step solutions from verified subject matter experts