

Question: Directions to complete Using Power Point or any other flow chart application, to create a process flow chart which will display your letter grade (
Directions to complete
Using Power Point or any other flow chart application, to create a process flow chart which will display
your letter grade output based on your numeric grade input
Use the below matrix as ruling points to create your process flow chart.
Use Times New Roman font size for symbols and font size for Yes or No decision exits.
Use Landscape orientation.
Choose your own color scheme for your presentation.
Add your first and last name along with Chapter Project at the top left side of your power point
presentation.
Check your work by entering several input values to see if the letter grade comes out as you
expect. Make corrections to your process flow as required.
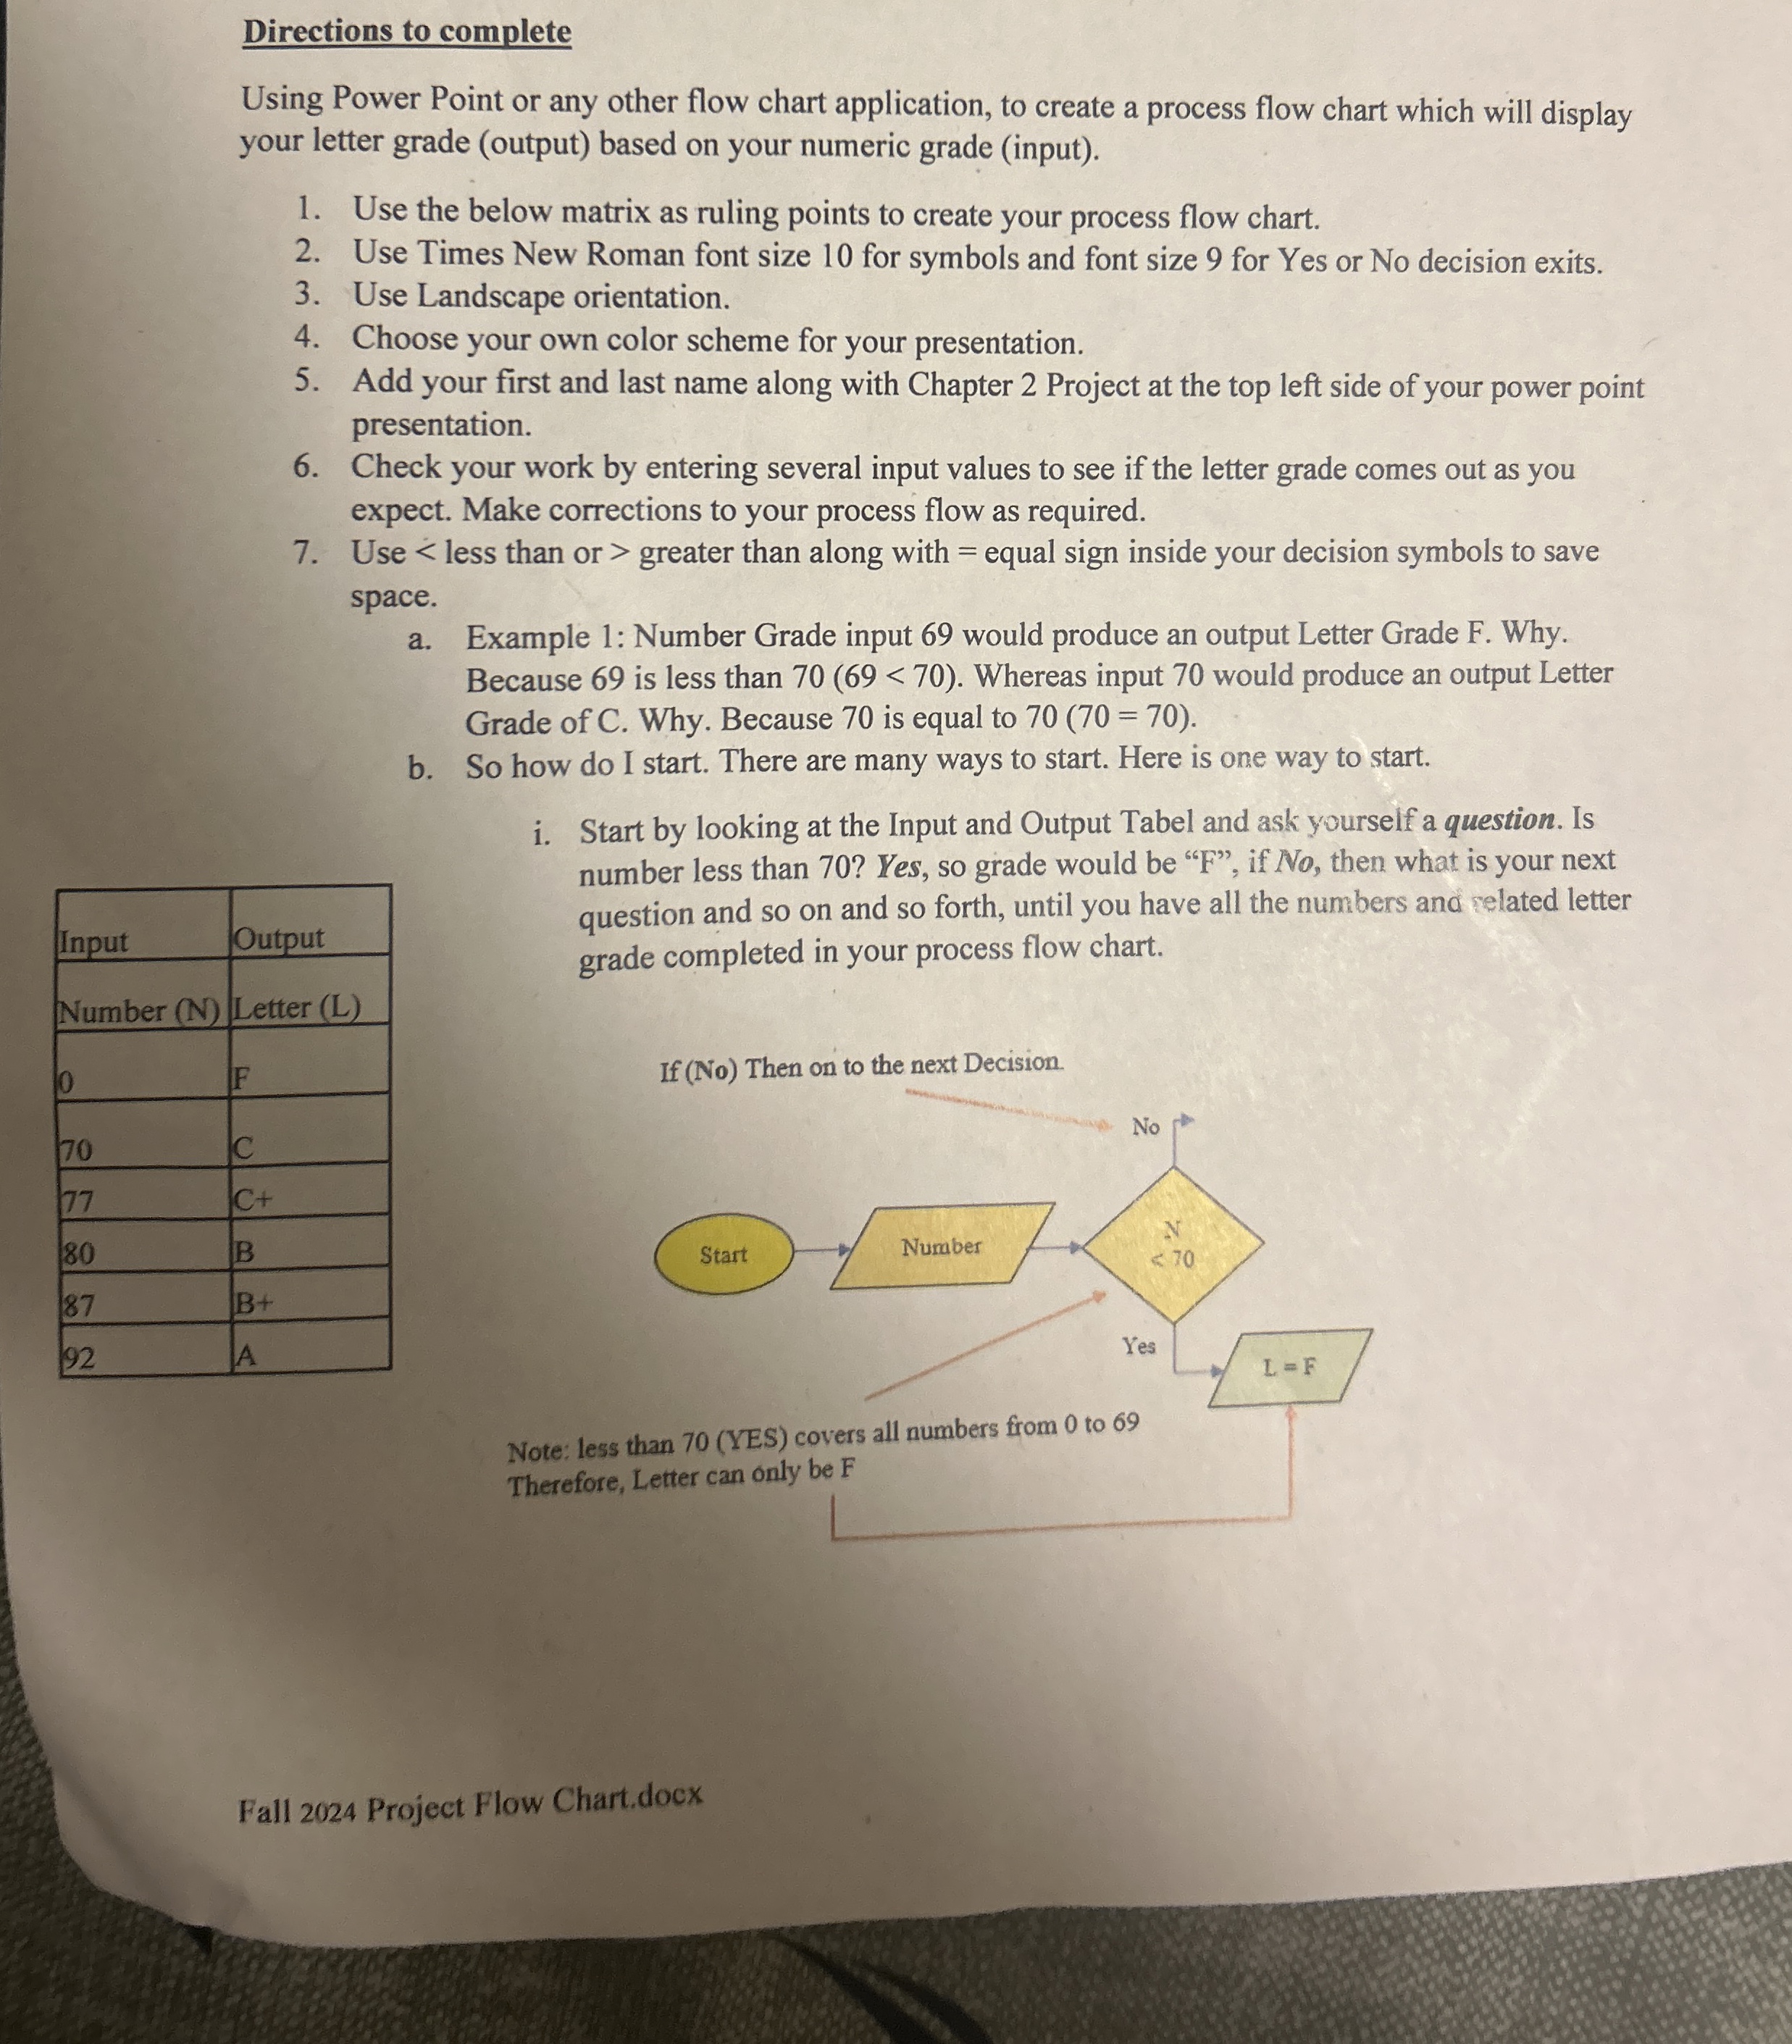
Use less than or greater than along with equal sign inside your decision symbols to save
space.
a Example : Number Grade input would produce an output Letter Grade F Why.
Because is less than
Step by Step Solution
There are 3 Steps involved in it
1 Expert Approved Answer
Step: 1 Unlock

Question Has Been Solved by an Expert!
Get step-by-step solutions from verified subject matter experts
Step: 2 Unlock
Step: 3 Unlock