

Question: Discuss the graphic below, which shows risk-return profiles for a general portfolio consisting of a debt security and an equity security, where alternative correlations
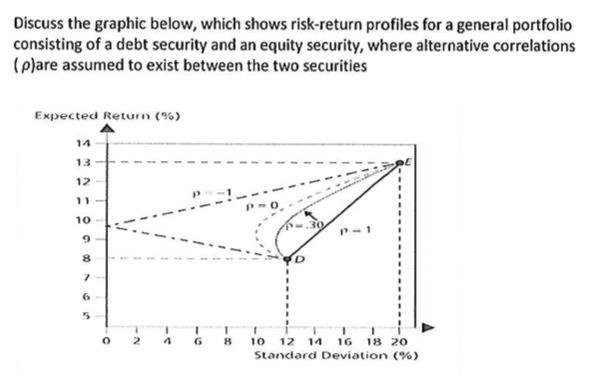
Discuss the graphic below, which shows risk-return profiles for a general portfolio consisting of a debt security and an equity security, where alternative correlations (p)are assumed to exist between the two securities Expected Return (%) 14 13 12 10 9 8 7 6 5 0 -N 2 4 6 1 T 1 8 10 12 14 16 18 20 Standard Deviation (%)
Step by Step Solution
★★★★★
3.61 Rating (148 Votes )
There are 3 Steps involved in it
1 Expert Approved Answer
Step: 1 Unlock

The table shows the portfolio return and risk for four correlation coefficients rang... View full answer
Question Has Been Solved by an Expert!
Get step-by-step solutions from verified subject matter experts
Step: 2 Unlock
Step: 3 Unlock