

Question: Discuss with justification whether or not it would be appropriate to use a straight-line graph to represent the data points on the scatterplot in Figure
Discuss with justification whether or not it would be appropriate to use a straight-line graph to represent the data points on the scatterplot in Figure 2 between: month 2 and month 6 and month 2 and month 12.
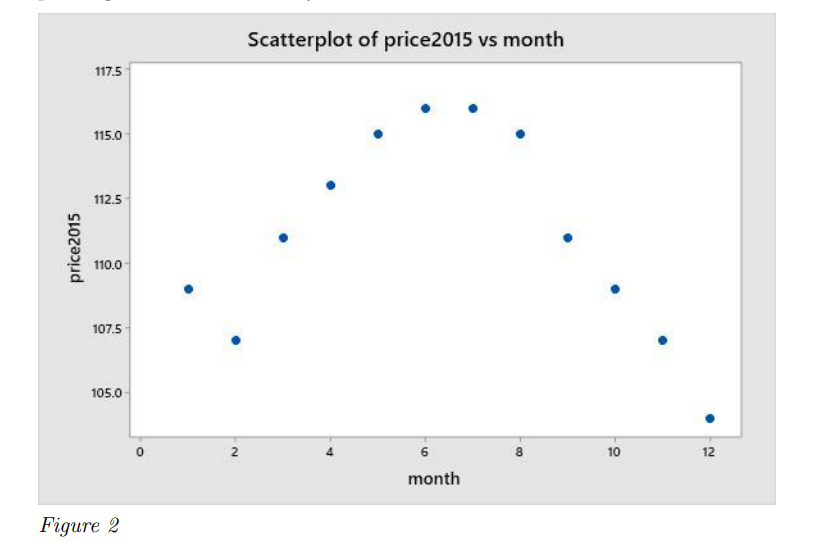
Scatterplot of price2015 vs month 117.5 115.0 112.5 price2015 110.0 107.5 105.0 0 2 6 8 10 12 month Figure 2
Step by Step Solution
There are 3 Steps involved in it
1 Expert Approved Answer
Step: 1 Unlock

Question Has Been Solved by an Expert!
Get step-by-step solutions from verified subject matter experts
Step: 2 Unlock
Step: 3 Unlock