

Question: Discussion Case Financial Statement Analysis - Part II The following case involves financial analysis of Activision Blizzard, Inc. (Activision or the Company). Activision has its
Discussion Case Financial Statement Analysis - Part II The following case involves financial analysis of Activision Blizzard, Inc. (Activision or the Company). Activision has its corporate headquarters in California, it is listed on the NASDAQ, and it is a worldwide publisher of online, personal computer, video game console, handheld, mobile and tablet games. This case involves the analysis of Activisions business strategy, accounting policy and financial performance.
Required: Address the following questions based on your evaluation of the Form 10-Ks for Activision for the five years ended December 31, 2021. Begin your analysis with the spreadsheet posted online containing the raw data associated with the financial statement information (file entitled Discussion Case - FSA (data)).
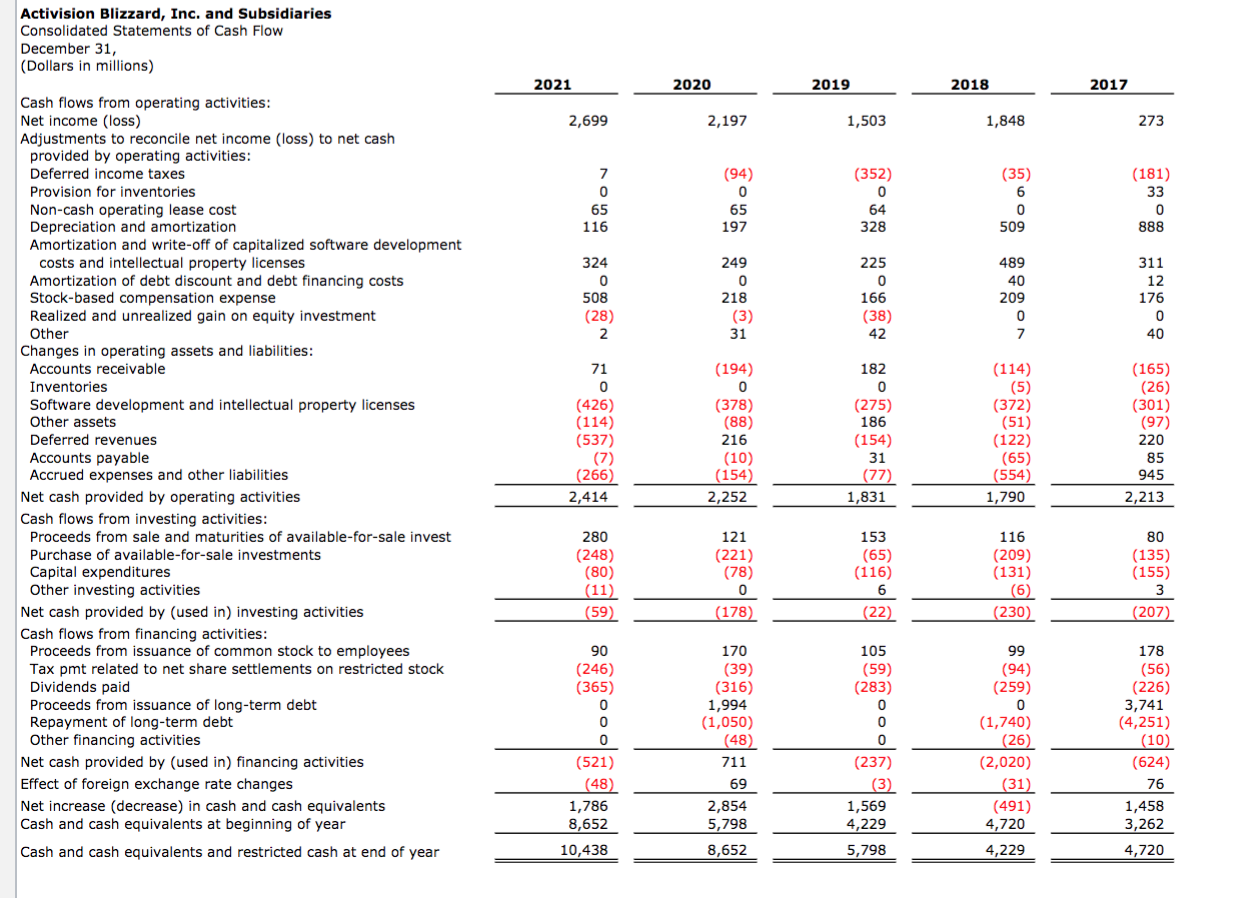
1.) Cash Flows This part will ask you to perform a detailed analysis of Activisions cash flows for the year ended December 31, 2021 and a summary analysis of Activisions cash flows for the five-year period ended December 31, 2021.
a) For the year ended December 31, 2021 identify material differences between reported operating cash flow and sustainable operating cash flow, if any. Also, in your team's opinion, how strong is Activisions sustainable cash flow from operations and its sustainable free cash flow? [Note: Operating cash flow is affected by income from operations and the adjustments for non-cash revenue and expense, but operating cash flow is also affected by the change in operating assets and liabilities (e.g., accounts receivable, inventory, accounts payable, etc.). Cash may be increased, for example, by the collection of accounts receivable - in excess of current year sales - or by not paying accounts payable. If, for example, the cash generated from not paying accounts payable is considered excessive, or not normal or not sustainable (i.e., the company must pay accounts payable eventually and the current year adjustment is far in excess of what could be considered normal), you will need to adjust operating cash flow to remove the excess amount related to accounts payable. The adjusted operating cash flow is sustainable operating cash flow.] b) Develop an overall summary of the key elements of Activisions investing and financing cash flows for the year ended December 31, 2021. This is less about calculating the numbers and more about analyzing and evaluating what the numbers tell you, and the conclusions you can reach from the financial statements. Discuss the overall trends in Activisions cash flows for the five years ended December 31, 2021.
2.) Operating Cycle This part will ask you to perform a detailed analysis of Activisions operating cycle for the five- year period ended December 31, 2021.
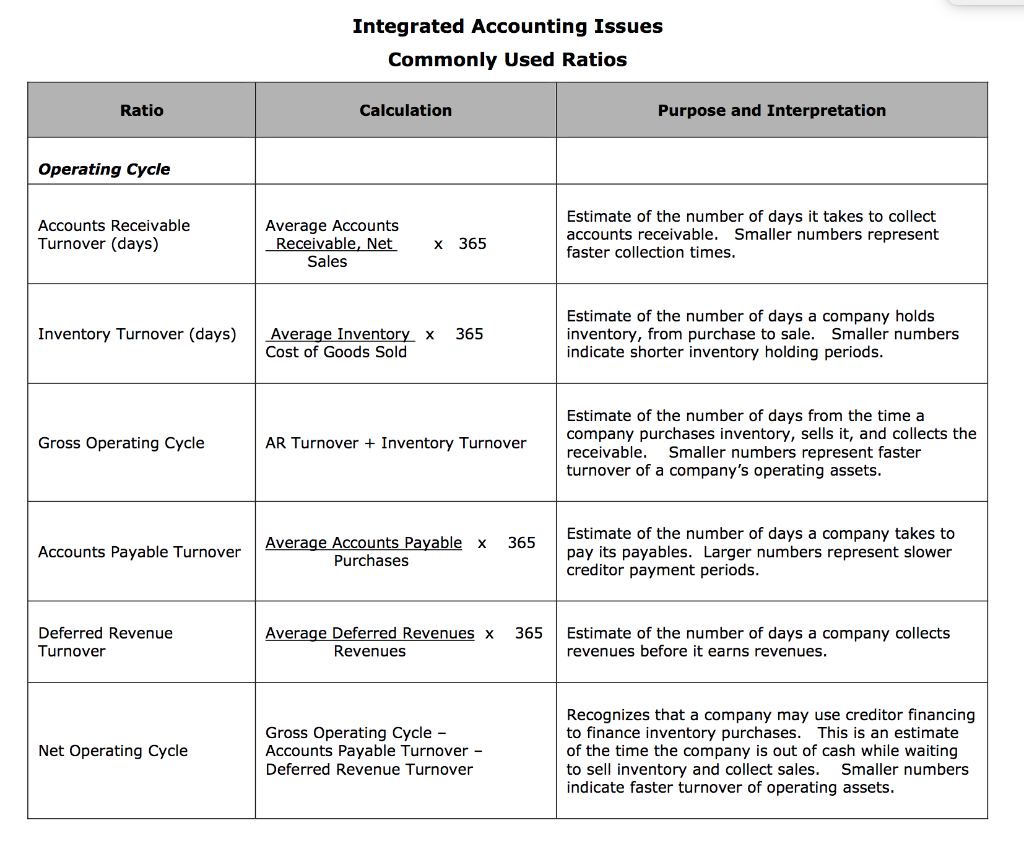
a) Using the Commonly Used Ratios (see the file Discussion Case - FSA (Ratios)), calculate the Operating Cycle ratios for each of the five years ended December 31, 2021.
b) Discuss the overall trends over the five-year period in terms of how the Company has managed its operating cycle. Address how the Company has managed its operating cycle through periods of growth or decline. Also address how the Company's strategy is reflected in its operating cycle. This discussion should be focused on analyzing and evaluating what the numbers tell you, and the conclusions you can reach from the financial statements.
Here is the formula for the Operating Cycle ratios :
Please read the requirements on
question 1. Cash flows
2. Operating Cycle
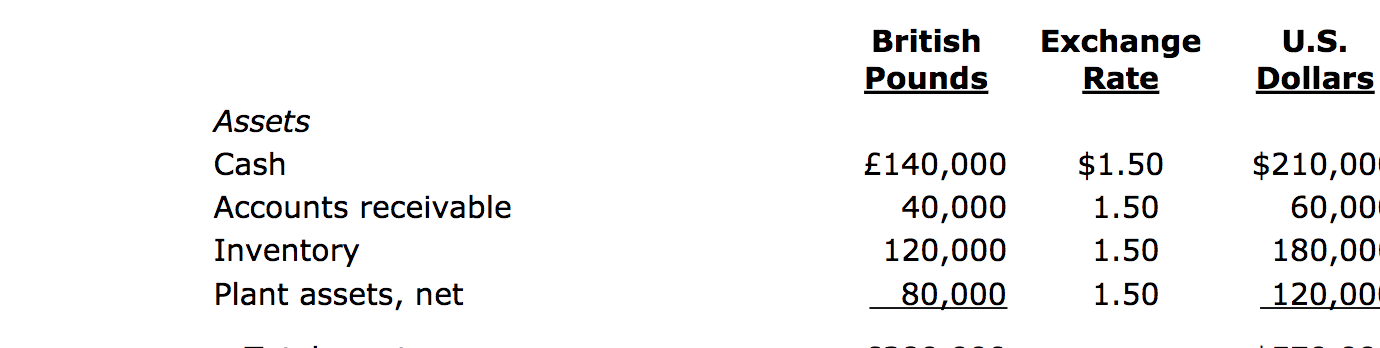
British Pounds Exchange Rate U.S. Dollars Assets Cash Accounts receivable Inventory Plant assets, net 140,000 40,000 120,000 80,000 $1.50 1.50 1.50 1.50 $210,00 60,00 180,00 120,00 Activision Blizzard, Inc. and Subsidiaries Consolidated Statements of Cash Flow December 31, (Dollars in millions) 2021 2020 2019 2018 2017 2,699 2,197 1,503 1,848 273 (94) 0 65 197 (352) 0 0 64 328 (35) 6 6 0 509 (181) 33 0 888 249 0 218 (3) 31 225 0 166 (38) 42 489 40 209 0 7 311 12 176 0 40 Cash flows from operating activities: Net income (loss) Adjustments to reconcile net income (loss) to net cash provided by operating activities: Deferred income taxes Provision for inventories Non-cash operating lease cost Depreciation and amortization Amortization and write-off of capitalized software development costs and intellectual property licenses Amortization of debt discount and debt financing costs Stock-based compensation expense Realized and unrealized gain on equity investment Other Changes in operating assets and liabilities: Accounts receivable Inventories Software development and intellectual property licenses Other assets Deferred revenues Accounts payable Accrued expenses and other liabilities Net cash provided by operating activities Cash flows from investing activities: Proceeds from sale and maturities of available-for-sale invest Purchase of available-for-sale investments Capital expenditures Other investing activities Net cash provided by (used in) investing activities Cash flows from financing activities: Proceeds from issuance of common stock to employees Tax pmt related to net share settlements on restricted stock Dividends paid Proceeds from issuance of long-term debt Repayment of long-term debt Other financing activities Net cash provided by (used in) financing activities Effect of foreign exchange rate changes Net increase (decrease) in cash and cash equivalents Cash and cash equivalents at beginning of year Cash and cash equivalents and restricted cash at end of year nogo srg ^ 5 369) 3238 23902 (194) 0 (378) (88) 216 (10) (154) 2,252 182 0 0 (275) 186 (154) 31 (77) 1,831 (114) (5) (372) (51) (122) (65) (554) ) 1,790 (165) (26) (301) (97) 220 85 945 2,213 121 (221) () (78) 153 (65) (116) 6 (22) 116 (209) (131) (6) 6 (230) 80 (135) (155) 3 (207) 0 (178) 170 (39) (316) 1,994 (1,050) (48) 711 69 2,854 5,798 105 (59) (283) 0 0 0 0 0 (237) (3) 1,569 4,229 5,798 99 (94) (259) 0 (1,740) (26) (2,020) (31) (491) 4,720 4,229 178 (56) (226) 3,741 (4,251) (10) (624) 76 1,458 3,262 4,720 (48) 8,652 Integrated Accounting Issues Commonly Used Ratios Ratio Calculation Purpose and Interpretation Operating Cycle Accounts Receivable Turnover (days) Average Accounts Receivable, Net Sales Estimate of the number of days it takes to collect accounts receivable. Smaller numbers represent faster collection times. X 365 Inventory Turnover (days) 365 Average Inventory X Cost of Goods Sold Estimate of the number of days a company holds inventory, from purchase to sale. Smaller numbers indicate shorter inventory holding periods. Gross Operating Cycle AR Turnover + Inventory Turnover Estimate of the number of days from the time a company purchases inventory, sells it, and collects the receivable. Smaller numbers represent faster turnover of a company's operating assets. 365 Accounts Payable Turnover Average Accounts Payable x Purchases Estimate of the number of days a company takes to pay its payables. Larger numbers represent slower creditor payment periods. 365 Deferred Revenue Turnover Average Deferred Revenues x Revenues Estimate of the number of days a company collects revenues before it earns revenues. Net Operating Cycle Gross Operating Cycle - Accounts Payable Turnover Deferred Revenue Turnover Recognizes that a company may use creditor financing to finance inventory purchases. This is an estimate of the time the company is out of cash while waiting to sell inventory and collect sales. Smaller numbers indicate faster turnover of operating assets. British Pounds Exchange Rate U.S. Dollars Assets Cash Accounts receivable Inventory Plant assets, net 140,000 40,000 120,000 80,000 $1.50 1.50 1.50 1.50 $210,00 60,00 180,00 120,00 Activision Blizzard, Inc. and Subsidiaries Consolidated Statements of Cash Flow December 31, (Dollars in millions) 2021 2020 2019 2018 2017 2,699 2,197 1,503 1,848 273 (94) 0 65 197 (352) 0 0 64 328 (35) 6 6 0 509 (181) 33 0 888 249 0 218 (3) 31 225 0 166 (38) 42 489 40 209 0 7 311 12 176 0 40 Cash flows from operating activities: Net income (loss) Adjustments to reconcile net income (loss) to net cash provided by operating activities: Deferred income taxes Provision for inventories Non-cash operating lease cost Depreciation and amortization Amortization and write-off of capitalized software development costs and intellectual property licenses Amortization of debt discount and debt financing costs Stock-based compensation expense Realized and unrealized gain on equity investment Other Changes in operating assets and liabilities: Accounts receivable Inventories Software development and intellectual property licenses Other assets Deferred revenues Accounts payable Accrued expenses and other liabilities Net cash provided by operating activities Cash flows from investing activities: Proceeds from sale and maturities of available-for-sale invest Purchase of available-for-sale investments Capital expenditures Other investing activities Net cash provided by (used in) investing activities Cash flows from financing activities: Proceeds from issuance of common stock to employees Tax pmt related to net share settlements on restricted stock Dividends paid Proceeds from issuance of long-term debt Repayment of long-term debt Other financing activities Net cash provided by (used in) financing activities Effect of foreign exchange rate changes Net increase (decrease) in cash and cash equivalents Cash and cash equivalents at beginning of year Cash and cash equivalents and restricted cash at end of year nogo srg ^ 5 369) 3238 23902 (194) 0 (378) (88) 216 (10) (154) 2,252 182 0 0 (275) 186 (154) 31 (77) 1,831 (114) (5) (372) (51) (122) (65) (554) ) 1,790 (165) (26) (301) (97) 220 85 945 2,213 121 (221) () (78) 153 (65) (116) 6 (22) 116 (209) (131) (6) 6 (230) 80 (135) (155) 3 (207) 0 (178) 170 (39) (316) 1,994 (1,050) (48) 711 69 2,854 5,798 105 (59) (283) 0 0 0 0 0 (237) (3) 1,569 4,229 5,798 99 (94) (259) 0 (1,740) (26) (2,020) (31) (491) 4,720 4,229 178 (56) (226) 3,741 (4,251) (10) (624) 76 1,458 3,262 4,720 (48) 8,652 Integrated Accounting Issues Commonly Used Ratios Ratio Calculation Purpose and Interpretation Operating Cycle Accounts Receivable Turnover (days) Average Accounts Receivable, Net Sales Estimate of the number of days it takes to collect accounts receivable. Smaller numbers represent faster collection times. X 365 Inventory Turnover (days) 365 Average Inventory X Cost of Goods Sold Estimate of the number of days a company holds inventory, from purchase to sale. Smaller numbers indicate shorter inventory holding periods. Gross Operating Cycle AR Turnover + Inventory Turnover Estimate of the number of days from the time a company purchases inventory, sells it, and collects the receivable. Smaller numbers represent faster turnover of a company's operating assets. 365 Accounts Payable Turnover Average Accounts Payable x Purchases Estimate of the number of days a company takes to pay its payables. Larger numbers represent slower creditor payment periods. 365 Deferred Revenue Turnover Average Deferred Revenues x Revenues Estimate of the number of days a company collects revenues before it earns revenues. Net Operating Cycle Gross Operating Cycle - Accounts Payable Turnover Deferred Revenue Turnover Recognizes that a company may use creditor financing to finance inventory purchases. This is an estimate of the time the company is out of cash while waiting to sell inventory and collect sales. Smaller numbers indicate faster turnover of operating assets
Step by Step Solution
There are 3 Steps involved in it

Get step-by-step solutions from verified subject matter experts