

a.) What was Campbell's dividend payout ratio and retention ratio for each of the last five...
Fantastic news! We've Found the answer you've been seeking!
Question:
Transcribed Image Text:
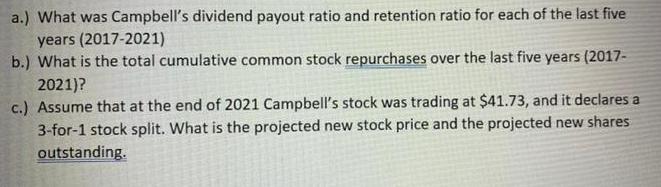
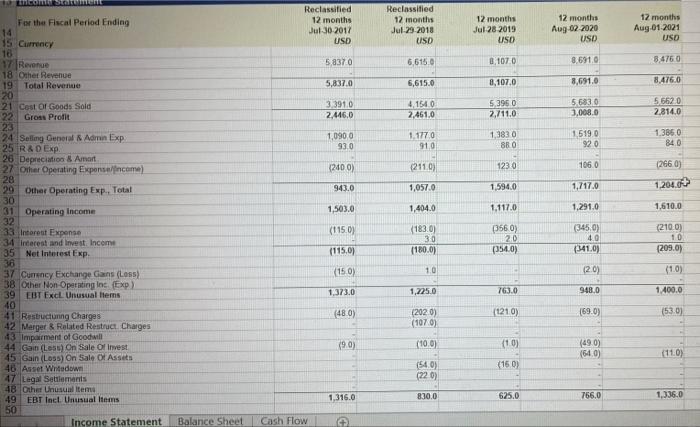
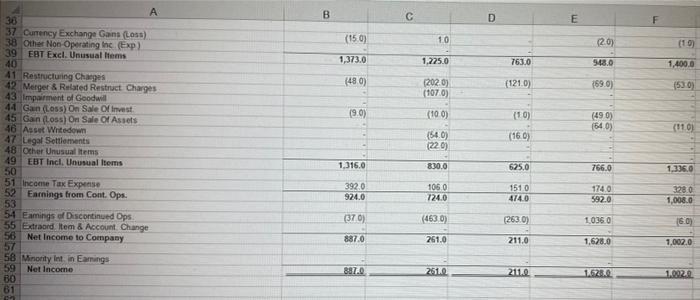
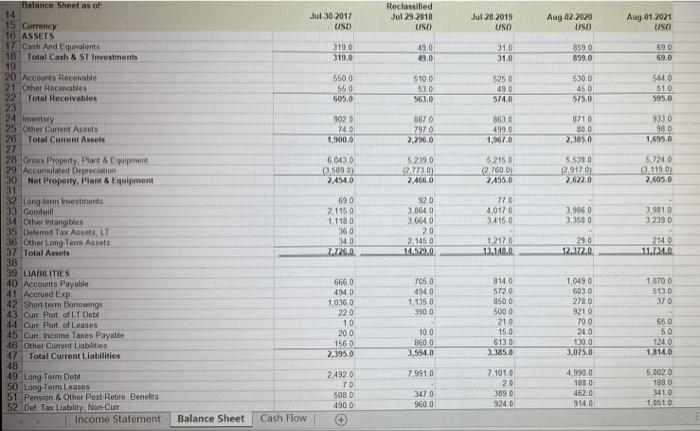
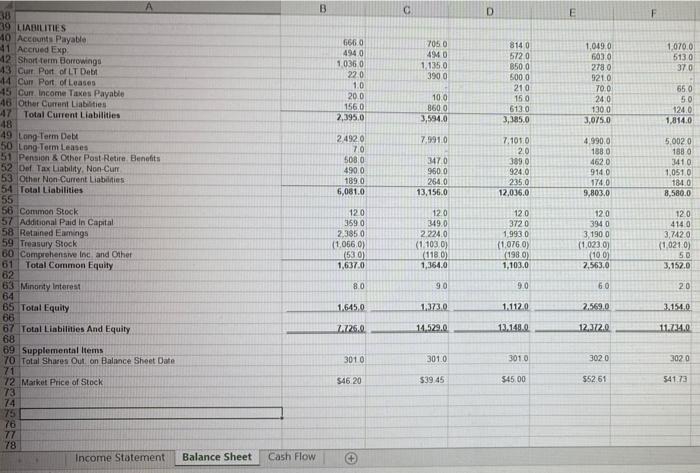
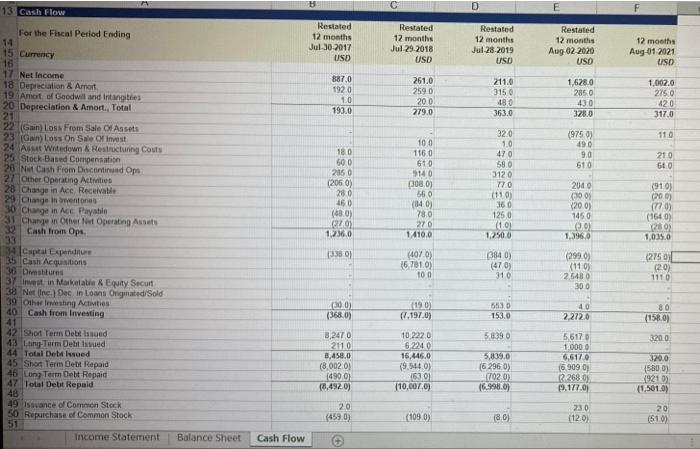
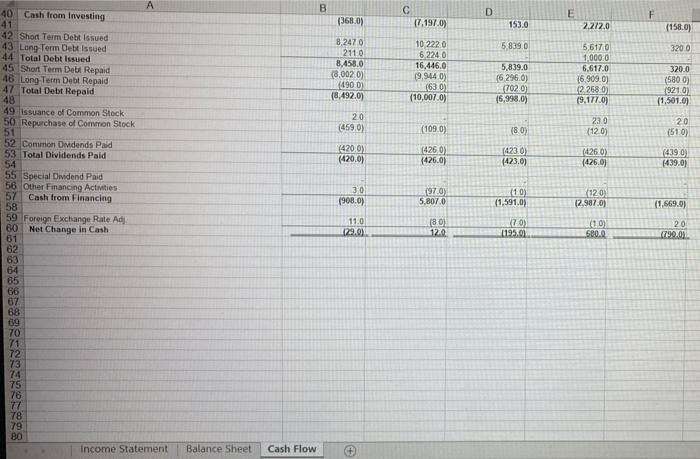
a.) What was Campbell's dividend payout ratio and retention ratio for each of the last five years (2017-2021) b.) What is the total cumulative common stock repurchases over the last five years (2017- 2021)? c.) Assume that at the end of 2021 Campbell's stock was trading at $41.73, and it declares a 3-for-1 stock split. What is the projected new stock price and the projected new shares outstanding. Reclassified 12 months Reclassified 12 months 12 months 12 months 12 months For the Fiscal Period Ending 14 15 Currency 16 17 Revenue 18 Other Revenue 19 Total Revenue 20 21 Cest Of Goods Sold 22 Gross Profit 23 24 Selling General & Admin Exp 25 R&DExp 26 Depreciation & Amart 27 Ofher Operating Exponseinceme) 28 29 Other Operating Exp., Total 30 31 Operating Income 32 33 Interest Expense :34 interest and Invest. Inceme 35 Net Interest Exp. 36 37 Cumency Exchange Gans (Los) 38 Other Non Operating Inc. (Exp) 39 Jul 28 2019 USD Aug-02-2020 USD Aug 01-2021 USD Jul 30-2017 Jul-29-2018 USD USD 5,8370 6,615.0 0,107.0 8.691.0 8476 0 5,837.0 6,615.0 8,107.0 8,691.0 8,476.0 5.683.0 3,008.0 5,6620 2.814.0 3.391.0 4,154.0 5,396 0 2,446.0 2,461.0 2,/11.0 1,090 0 93.0 1.177.0 91.0 1,383 0 88 0 1,519.0 92 0 1.386.0 84.0 (240 0) (211.0) 123 0 106.0 (266 0) 1,594.0 1,717.0 1,204. 943.0 1,057.0 1,503.0 1,404.0 1,117.0 1,291.0 1,610.0 (345.0) (183.0) 30 (180.0) (356 0) 20 (210.0) 10 (209.0) (115.0) 4.0 (115.0) p54.0) (341.0) (15.0) 1.0 (2.0) (1.0) 1.373.0 1,225.0 763.0 948.0 1,400.0 EBT Excl Unusual tems 40 41 Restructunng Charges 42 Merger & Related Restruct Charges 43 Impairment of Goodwill 44 Gain (Less) On Sale Of Invest 45 Gain (Loss) On Sale Of Assets 46 Asset Witedown 47 Legal Settlements 48 Other Unusual Itema 49 EBT Inct. Unusual Items 50 (48.0) (202.0) (107 0) (121.0) (69.0) (53.0) (49.0) (64.0) (9.0) (10.0) (10) (11.0) (54.0) (22 0) (16 0) 1,316.0 830.0 625.0 766.0 1,336.0 Income Statement Balance Sheet Cash Flow A 36 37 Curency Exchange Gans (Loss) 38 Other Non-Operating Inc (Exp ) 39 EBT Excl. Unusual Items 40 41 Restructuring Charges 42 Merger & Related Restruct Charges 43 Impairment of Goodwill 44 Gan (Loss) On Sale Of invest (15.0) 1.0 (20) (10) 1,373.0 1,225.0 763.0 548.0 1,400.0 (202. 0) (107.0) (48.0) (121.0) (69.0) (53 0) (9.0) (10 0) (10) 45 Gain (Loss) On Sale Of Assets 46 Asset Writedown (49 0) (64 0) (11 0) (54.0) (22.0) (16.0) 47 Legal Settiements 48 Other Unusual items 49 EBT Incl. Unusual Items 50 51 Income Tax Expense 52 Earnings from Cont. Ops. 53 54 Eamings of Discontinued Ops 55 Extraord. Item & Account. Change 56 1,316.0 830.0 625.0 766.0 1,336.0 392.0 924.0 106.0 724.0 151.0 474.0 174.0 328.0 1,008.0 592.0 (37.0) (463.0) (263.0) 1,036.0 (6.0) Net Income to Company 57 58 Minority Int in Eamings 887.0 261.0 211.0 1,628.0 1,002.0 59 Net Income 887.0 261.0 211.0 1.628.0 1.002.0 60 61 Balance Sheet as of 14 Reclassified Jul 29.2018 Jul-30 2017 Jul-28 2019 USD Aug 02.2020 USO Aug 01 2021 USD 15 Currency 16 ASSETS 17 Cash And Equivalents 18 Total Cash & ST Investments 19 20 Accounts Receable 21 Other Receivaties 22 Total Receivables 23 24 ventery 25 Other Current Assets 20 Total Current Assets 27 28 Gross Property, Plant & Equipment 29 Accumulated Depreciation 30 Net Property, Plant & Equipment 31 32 Long term investments 33 Goodwill 34 other Intangibles 35 Defered Tax Assets, LT 36 Other Long-Term Assets 37 Total Assets 38 39 LIABILITIES 40 Accounts Payable 41 Accrued Exp 42 Short term Bortowings 43 Cun. Port of LT Debt 44 Cur Port. of Leases 45 Curr Income Taxes Payatle 46 Other Current Liablities 47 USD USD 319.0 319.0 49 0 49.0 31.0 31.0 859 0 859.0 69.0 69.0 550.0 530.0 45 0 510 0 526 0 53.0 563.0 544 0 51.0 595.0 49.0 605.0 574.0 575.0 902 0 74 0 1,900.0 B87 0 797 0 2,296.0 863 0 499.0 871.0 800 2,165.0 9330 96 0 1,695.0 1,967.0 6,043.0 3509 0) 2,454.0 5216 0 (2.760.0) 2455.0 5,724.0 0.119.0) 2,605.0 5,539 0 5,29 0 2.773.0) 2,466.0 2,622.0 690 2.115.0 1,118 0 36 0 34.0 92.0 3,864 0 3.664 0 17.0 4,0170 3415.0 3,986 0 3.350 0 3.901.0 3.239 0 20 2,145 0 14.529.0 1217.0 13.148.0 29.0 SP372.0 214.0 11.734.0 1.126.0 814.0 572.0 1,070 0 513.0 37.0 666 0 494 0 1.036 0 22.0 1.0 1,049 0 603.0 278.0 921.0 70 0 24.0 705 0 494 0 1,135 0 390 0 850.0 500 0 210 15.0 20.0 156 0 2,395.0 10.0 860 0 3,594.0 65.0 5.0 124.0 613.0 130.0 3,385.0 3,075.0 1,814.0 Total Current Liabilities 48 49 Long-Term Debt 50 Long-Term Leases 51 Pension & Other Post-Retire Benefits 52 Det. Tax Liablity, Non-Cur 4.990.0 188.0 4620 5.002 0 188.0 7.991 0 7.101.0 24920 70 20 389 0 924 0 341.0 508 0 4900 347.0 960 0 9140 1,051.0 Income Statement Balance Sheet Cash Flow B C. D. F 38 39 LIABILITIES -40 Accounts Payable 41 Accrued Exp. 42 Short term Borrowings 43 Curr Port of LT Debt 44 Cun Port of Leases 45 Cun Income Taxes Payable 46 Other Current Liabilities -47 666.0 494.0 1,036 0 22.0 705 0 494 0 814 0 572.0 850 0 1,049.0 603.0 278 0 921.0 1,070.0 513.0 37.0 1.135.0 390.0 5000 21.0 1.0 70.0 24.0 65.0 20.0 156.0 10.0 15.0 860 0 3,594.0 613.0 3,385.0 130.0 3,075.0 5.0 124.0 1,814.0 Total Current Liabilities 48 49 Long Term Debt 50 Long-Term Leases 51 Pension & Other Post Retire. Benefits 52 Def Tax Liability, Non-Cum 53 Jother Non Current Liabilities 54 Total Liabilities 55 56 Common Stock 57 Additional Paid in Capital 58 Retained Eamings 59 Treasury Stock 60 Comprehensve Inc and Other 61 2,395.0 2492.0 7.0 508 0 7.991.0 7.101 0 4,990.0 188.0 462.0 5,002. 0 188 0 2.0 389.0 924.0 235.0 12.036.0 347.0 341.0 1,051.0 184.0 8,580.0 490.0 189.0 960.0 264.0 914.0 174,0 9,803.0 6,081.0 13,156.0 120 12.0 349.0 120 3720 12.0 394.0 12.0 359 0 2,385 0 (1,066.0) (53 0) 1,637.0 2.224.0 (1.103 0) (118 0) 1,364.0 1,993 0 (1.076 0) (198 O) 1,103.0 3,190 0 (1,023.0) (10.0) 2,563.0 414.0 3,742.0 (1,021.0) 5.0 3,152.0 Total Common Equity 62 63 Minonty Interest 64 65 Total Equity 66 67 Total Liabilities And Equity 68 69 Supplemental Items 70 Total Shares Out. on Balance Sheet Date 71 72 Market Price of Stock 73 74 75 76 77 8.0 9.0 9.0 60 20 1.645.0 1.373.0 1.112.0 2.569.0 3.154.0 L.126.0 14,529.0 13.148.0 12.372.0 11.74.0 3010 301.0 301.0 302 0 302 0 S46.20 $39 45 $45.00 $52 61 541.73 78 Income Statement Balance Sheet Cash Flow 13 Cash Flow Restated 12 months Jul-30 2017 Restated 12 months Jul 29.2018 Restated 12 months Restated For the Fiscal Period Ending 14 15 Currency 16 17 Net lecome 18 Depreciation & Amort 19 Amot of Goodwill and Intangibles 20 Depreciation & Amort., Total 21 22 (Gan) Loss From Sale Of Assets 23 Gan) Loss On Sale Of Invest 24 Asset Witedown & Restructuring Costs 25 Stock-Based Compensation 26 Net Cash From Discontinued Ops 27 Other Operating Activities 28 Change in Ace. Receivatile 29 Change in bnentones 30 Change in Acc Payatle 31 Change in Other Net Operatirng Assets 32 Cash from Ops 33 34 Captal Eapenditure 35 Cash Acqusitions 36 Dvestitures 37 invest in Marketatie & Equity Securt 38 Net (Inc.) Dec in Loans Originated/Sold 39 Other Investing Activties 12 months 12 months Aug 02.2020 USD Jul 28.2019 Aug 01 2021 USD USD USD USD 887.0 261.0 211.0 1,628.0 285.0 1,002.0 192.0 259.0 20.0 279.0 315.0 480 275.0 420 10 43.0 328.0 193.0 363.0 317.0 32.0 1.0 470 (975 0) 490 9.0 11.0 10 0 18.0 116.0 60.0 205 0 610 914 0 58.0 312.0 77.0 21.0 640 610 (206 0) 28.0 46 0 (48. 0) (308.0) 56.0 (14 0) 78.0 270 1,410.0 204 0 (91.0) (11 0) 36 0 (30 0) (20 0) 145 0 (7 0) (164 0) 125 0 (1.0) 1,250.0 1,236.0 1.396.0 1,035.0 (407.0) (6,781.0) 10 0 (384 0) (47 0) 310 (299.0) (11 0) 2,548 0 300 (275 0 (20) 1110 00.0) (368.0) (19.0) (7,197.0) 553.0 153.0 4.0 Cash from Investing 80 (158.0) 40 2,272.0 41 42 Short Term Dett isaued 43 Lang-Turm Debt tsvued 44 Total Debt Issued 45 Shot Term Debt Repaid 46 Long Term Debt Repaid 47 Total Debt Repaid 48 49 Issuance of Common Stock 50 Repurchase of Common Stock 51 8,247.0 2110 10 222.0 6.224 0 16,446.0 (9.544.0) 63 0) (10,007.0) 5.839 0 5.6170 1.000 0 6,617.0 (6,909 0 2.268 0) 9.177.0) 320.0 8,458.0 5,839.0 320.0 (8,002 0) (490.0) (8,492.0) (6.296 0) (702 0) (6.998.0) (580 0) (921 0) (1,501.0) 2.0 (109 0) 23.0 (12.0) 20 (51.0) (459.0) (80) Income Statement Balance Sheet Cash Flow A B 40 Cash from Investing 41 42 Short Term Debt Issued 43 Long Term Debt Issued 44 Total Debt Issued 45 Shart Term Dett Repaid 46 Long-Term Debt Repaid 47 Total Debt Repaid 48 49 issuance of Common Stock 50 Repurchase of Common Stock 51 52 Common Dividends Paid 53 Total Dividends Paid 54 55 Special Dividend Paid 56 Other Financing Activties 57 (368.0) (7,197.0) 153.0 2.2/2.0 (158.0) 8,2470 2110 8,458.0 (8.002 0) (490 0) (8,492.0) 10,222.0 6.224.0 16,446.0 5,839.0 5,6170 1,0000 320.0 5,839.0 (6.296.0) (702 0) (6,998.0) 6,617.0 320.0 (9,944 0) (63.0) (10,007.0) (6,909.0) (2.268 0) (9,177.0) (580 0) (921.0) (1,501.0) 20 23.0 20 (459.0) (109 0) (8.0) (12.0) (51.0) (420.0) (420.0) (426.0) (426.0) (423.0) (423.0) (426 0) (426.0) (439.0) (439.0) 3.0 (908.0) (97.0) 5,807.0 (1.0) (1,591.0) (12 0) (2,987.0) Cash from Financing 58 59 Foreign Exchange Rate Ad 60 (1,669.0) 11.0 (8.0) 12.0 (70) 1195.0 (1.0) 580.0 20 (790.01 Net Change in Cash 61 62 63 64 65 66 67 68 69 70 71 72 73 74 75 76 77 78 79 80 129.0) Income Statement Balance Sheet Cash Flow a.) What was Campbell's dividend payout ratio and retention ratio for each of the last five years (2017-2021) b.) What is the total cumulative common stock repurchases over the last five years (2017- 2021)? c.) Assume that at the end of 2021 Campbell's stock was trading at $41.73, and it declares a 3-for-1 stock split. What is the projected new stock price and the projected new shares outstanding. Reclassified 12 months Reclassified 12 months 12 months 12 months 12 months For the Fiscal Period Ending 14 15 Currency 16 17 Revenue 18 Other Revenue 19 Total Revenue 20 21 Cest Of Goods Sold 22 Gross Profit 23 24 Selling General & Admin Exp 25 R&DExp 26 Depreciation & Amart 27 Ofher Operating Exponseinceme) 28 29 Other Operating Exp., Total 30 31 Operating Income 32 33 Interest Expense :34 interest and Invest. Inceme 35 Net Interest Exp. 36 37 Cumency Exchange Gans (Los) 38 Other Non Operating Inc. (Exp) 39 Jul 28 2019 USD Aug-02-2020 USD Aug 01-2021 USD Jul 30-2017 Jul-29-2018 USD USD 5,8370 6,615.0 0,107.0 8.691.0 8476 0 5,837.0 6,615.0 8,107.0 8,691.0 8,476.0 5.683.0 3,008.0 5,6620 2.814.0 3.391.0 4,154.0 5,396 0 2,446.0 2,461.0 2,/11.0 1,090 0 93.0 1.177.0 91.0 1,383 0 88 0 1,519.0 92 0 1.386.0 84.0 (240 0) (211.0) 123 0 106.0 (266 0) 1,594.0 1,717.0 1,204. 943.0 1,057.0 1,503.0 1,404.0 1,117.0 1,291.0 1,610.0 (345.0) (183.0) 30 (180.0) (356 0) 20 (210.0) 10 (209.0) (115.0) 4.0 (115.0) p54.0) (341.0) (15.0) 1.0 (2.0) (1.0) 1.373.0 1,225.0 763.0 948.0 1,400.0 EBT Excl Unusual tems 40 41 Restructunng Charges 42 Merger & Related Restruct Charges 43 Impairment of Goodwill 44 Gain (Less) On Sale Of Invest 45 Gain (Loss) On Sale Of Assets 46 Asset Witedown 47 Legal Settlements 48 Other Unusual Itema 49 EBT Inct. Unusual Items 50 (48.0) (202.0) (107 0) (121.0) (69.0) (53.0) (49.0) (64.0) (9.0) (10.0) (10) (11.0) (54.0) (22 0) (16 0) 1,316.0 830.0 625.0 766.0 1,336.0 Income Statement Balance Sheet Cash Flow A 36 37 Curency Exchange Gans (Loss) 38 Other Non-Operating Inc (Exp ) 39 EBT Excl. Unusual Items 40 41 Restructuring Charges 42 Merger & Related Restruct Charges 43 Impairment of Goodwill 44 Gan (Loss) On Sale Of invest (15.0) 1.0 (20) (10) 1,373.0 1,225.0 763.0 548.0 1,400.0 (202. 0) (107.0) (48.0) (121.0) (69.0) (53 0) (9.0) (10 0) (10) 45 Gain (Loss) On Sale Of Assets 46 Asset Writedown (49 0) (64 0) (11 0) (54.0) (22.0) (16.0) 47 Legal Settiements 48 Other Unusual items 49 EBT Incl. Unusual Items 50 51 Income Tax Expense 52 Earnings from Cont. Ops. 53 54 Eamings of Discontinued Ops 55 Extraord. Item & Account. Change 56 1,316.0 830.0 625.0 766.0 1,336.0 392.0 924.0 106.0 724.0 151.0 474.0 174.0 328.0 1,008.0 592.0 (37.0) (463.0) (263.0) 1,036.0 (6.0) Net Income to Company 57 58 Minority Int in Eamings 887.0 261.0 211.0 1,628.0 1,002.0 59 Net Income 887.0 261.0 211.0 1.628.0 1.002.0 60 61 Balance Sheet as of 14 Reclassified Jul 29.2018 Jul-30 2017 Jul-28 2019 USD Aug 02.2020 USO Aug 01 2021 USD 15 Currency 16 ASSETS 17 Cash And Equivalents 18 Total Cash & ST Investments 19 20 Accounts Receable 21 Other Receivaties 22 Total Receivables 23 24 ventery 25 Other Current Assets 20 Total Current Assets 27 28 Gross Property, Plant & Equipment 29 Accumulated Depreciation 30 Net Property, Plant & Equipment 31 32 Long term investments 33 Goodwill 34 other Intangibles 35 Defered Tax Assets, LT 36 Other Long-Term Assets 37 Total Assets 38 39 LIABILITIES 40 Accounts Payable 41 Accrued Exp 42 Short term Bortowings 43 Cun. Port of LT Debt 44 Cur Port. of Leases 45 Curr Income Taxes Payatle 46 Other Current Liablities 47 USD USD 319.0 319.0 49 0 49.0 31.0 31.0 859 0 859.0 69.0 69.0 550.0 530.0 45 0 510 0 526 0 53.0 563.0 544 0 51.0 595.0 49.0 605.0 574.0 575.0 902 0 74 0 1,900.0 B87 0 797 0 2,296.0 863 0 499.0 871.0 800 2,165.0 9330 96 0 1,695.0 1,967.0 6,043.0 3509 0) 2,454.0 5216 0 (2.760.0) 2455.0 5,724.0 0.119.0) 2,605.0 5,539 0 5,29 0 2.773.0) 2,466.0 2,622.0 690 2.115.0 1,118 0 36 0 34.0 92.0 3,864 0 3.664 0 17.0 4,0170 3415.0 3,986 0 3.350 0 3.901.0 3.239 0 20 2,145 0 14.529.0 1217.0 13.148.0 29.0 SP372.0 214.0 11.734.0 1.126.0 814.0 572.0 1,070 0 513.0 37.0 666 0 494 0 1.036 0 22.0 1.0 1,049 0 603.0 278.0 921.0 70 0 24.0 705 0 494 0 1,135 0 390 0 850.0 500 0 210 15.0 20.0 156 0 2,395.0 10.0 860 0 3,594.0 65.0 5.0 124.0 613.0 130.0 3,385.0 3,075.0 1,814.0 Total Current Liabilities 48 49 Long-Term Debt 50 Long-Term Leases 51 Pension & Other Post-Retire Benefits 52 Det. Tax Liablity, Non-Cur 4.990.0 188.0 4620 5.002 0 188.0 7.991 0 7.101.0 24920 70 20 389 0 924 0 341.0 508 0 4900 347.0 960 0 9140 1,051.0 Income Statement Balance Sheet Cash Flow B C. D. F 38 39 LIABILITIES -40 Accounts Payable 41 Accrued Exp. 42 Short term Borrowings 43 Curr Port of LT Debt 44 Cun Port of Leases 45 Cun Income Taxes Payable 46 Other Current Liabilities -47 666.0 494.0 1,036 0 22.0 705 0 494 0 814 0 572.0 850 0 1,049.0 603.0 278 0 921.0 1,070.0 513.0 37.0 1.135.0 390.0 5000 21.0 1.0 70.0 24.0 65.0 20.0 156.0 10.0 15.0 860 0 3,594.0 613.0 3,385.0 130.0 3,075.0 5.0 124.0 1,814.0 Total Current Liabilities 48 49 Long Term Debt 50 Long-Term Leases 51 Pension & Other Post Retire. Benefits 52 Def Tax Liability, Non-Cum 53 Jother Non Current Liabilities 54 Total Liabilities 55 56 Common Stock 57 Additional Paid in Capital 58 Retained Eamings 59 Treasury Stock 60 Comprehensve Inc and Other 61 2,395.0 2492.0 7.0 508 0 7.991.0 7.101 0 4,990.0 188.0 462.0 5,002. 0 188 0 2.0 389.0 924.0 235.0 12.036.0 347.0 341.0 1,051.0 184.0 8,580.0 490.0 189.0 960.0 264.0 914.0 174,0 9,803.0 6,081.0 13,156.0 120 12.0 349.0 120 3720 12.0 394.0 12.0 359 0 2,385 0 (1,066.0) (53 0) 1,637.0 2.224.0 (1.103 0) (118 0) 1,364.0 1,993 0 (1.076 0) (198 O) 1,103.0 3,190 0 (1,023.0) (10.0) 2,563.0 414.0 3,742.0 (1,021.0) 5.0 3,152.0 Total Common Equity 62 63 Minonty Interest 64 65 Total Equity 66 67 Total Liabilities And Equity 68 69 Supplemental Items 70 Total Shares Out. on Balance Sheet Date 71 72 Market Price of Stock 73 74 75 76 77 8.0 9.0 9.0 60 20 1.645.0 1.373.0 1.112.0 2.569.0 3.154.0 L.126.0 14,529.0 13.148.0 12.372.0 11.74.0 3010 301.0 301.0 302 0 302 0 S46.20 $39 45 $45.00 $52 61 541.73 78 Income Statement Balance Sheet Cash Flow 13 Cash Flow Restated 12 months Jul-30 2017 Restated 12 months Jul 29.2018 Restated 12 months Restated For the Fiscal Period Ending 14 15 Currency 16 17 Net lecome 18 Depreciation & Amort 19 Amot of Goodwill and Intangibles 20 Depreciation & Amort., Total 21 22 (Gan) Loss From Sale Of Assets 23 Gan) Loss On Sale Of Invest 24 Asset Witedown & Restructuring Costs 25 Stock-Based Compensation 26 Net Cash From Discontinued Ops 27 Other Operating Activities 28 Change in Ace. Receivatile 29 Change in bnentones 30 Change in Acc Payatle 31 Change in Other Net Operatirng Assets 32 Cash from Ops 33 34 Captal Eapenditure 35 Cash Acqusitions 36 Dvestitures 37 invest in Marketatie & Equity Securt 38 Net (Inc.) Dec in Loans Originated/Sold 39 Other Investing Activties 12 months 12 months Aug 02.2020 USD Jul 28.2019 Aug 01 2021 USD USD USD USD 887.0 261.0 211.0 1,628.0 285.0 1,002.0 192.0 259.0 20.0 279.0 315.0 480 275.0 420 10 43.0 328.0 193.0 363.0 317.0 32.0 1.0 470 (975 0) 490 9.0 11.0 10 0 18.0 116.0 60.0 205 0 610 914 0 58.0 312.0 77.0 21.0 640 610 (206 0) 28.0 46 0 (48. 0) (308.0) 56.0 (14 0) 78.0 270 1,410.0 204 0 (91.0) (11 0) 36 0 (30 0) (20 0) 145 0 (7 0) (164 0) 125 0 (1.0) 1,250.0 1,236.0 1.396.0 1,035.0 (407.0) (6,781.0) 10 0 (384 0) (47 0) 310 (299.0) (11 0) 2,548 0 300 (275 0 (20) 1110 00.0) (368.0) (19.0) (7,197.0) 553.0 153.0 4.0 Cash from Investing 80 (158.0) 40 2,272.0 41 42 Short Term Dett isaued 43 Lang-Turm Debt tsvued 44 Total Debt Issued 45 Shot Term Debt Repaid 46 Long Term Debt Repaid 47 Total Debt Repaid 48 49 Issuance of Common Stock 50 Repurchase of Common Stock 51 8,247.0 2110 10 222.0 6.224 0 16,446.0 (9.544.0) 63 0) (10,007.0) 5.839 0 5.6170 1.000 0 6,617.0 (6,909 0 2.268 0) 9.177.0) 320.0 8,458.0 5,839.0 320.0 (8,002 0) (490.0) (8,492.0) (6.296 0) (702 0) (6.998.0) (580 0) (921 0) (1,501.0) 2.0 (109 0) 23.0 (12.0) 20 (51.0) (459.0) (80) Income Statement Balance Sheet Cash Flow A B 40 Cash from Investing 41 42 Short Term Debt Issued 43 Long Term Debt Issued 44 Total Debt Issued 45 Shart Term Dett Repaid 46 Long-Term Debt Repaid 47 Total Debt Repaid 48 49 issuance of Common Stock 50 Repurchase of Common Stock 51 52 Common Dividends Paid 53 Total Dividends Paid 54 55 Special Dividend Paid 56 Other Financing Activties 57 (368.0) (7,197.0) 153.0 2.2/2.0 (158.0) 8,2470 2110 8,458.0 (8.002 0) (490 0) (8,492.0) 10,222.0 6.224.0 16,446.0 5,839.0 5,6170 1,0000 320.0 5,839.0 (6.296.0) (702 0) (6,998.0) 6,617.0 320.0 (9,944 0) (63.0) (10,007.0) (6,909.0) (2.268 0) (9,177.0) (580 0) (921.0) (1,501.0) 20 23.0 20 (459.0) (109 0) (8.0) (12.0) (51.0) (420.0) (420.0) (426.0) (426.0) (423.0) (423.0) (426 0) (426.0) (439.0) (439.0) 3.0 (908.0) (97.0) 5,807.0 (1.0) (1,591.0) (12 0) (2,987.0) Cash from Financing 58 59 Foreign Exchange Rate Ad 60 (1,669.0) 11.0 (8.0) 12.0 (70) 1195.0 (1.0) 580.0 20 (790.01 Net Change in Cash 61 62 63 64 65 66 67 68 69 70 71 72 73 74 75 76 77 78 79 80 129.0) Income Statement Balance Sheet Cash Flow a.) What was Campbell's dividend payout ratio and retention ratio for each of the last five years (2017-2021) b.) What is the total cumulative common stock repurchases over the last five years (2017- 2021)? c.) Assume that at the end of 2021 Campbell's stock was trading at $41.73, and it declares a 3-for-1 stock split. What is the projected new stock price and the projected new shares outstanding. Reclassified 12 months Reclassified 12 months 12 months 12 months 12 months For the Fiscal Period Ending 14 15 Currency 16 17 Revenue 18 Other Revenue 19 Total Revenue 20 21 Cest Of Goods Sold 22 Gross Profit 23 24 Selling General & Admin Exp 25 R&DExp 26 Depreciation & Amart 27 Ofher Operating Exponseinceme) 28 29 Other Operating Exp., Total 30 31 Operating Income 32 33 Interest Expense :34 interest and Invest. Inceme 35 Net Interest Exp. 36 37 Cumency Exchange Gans (Los) 38 Other Non Operating Inc. (Exp) 39 Jul 28 2019 USD Aug-02-2020 USD Aug 01-2021 USD Jul 30-2017 Jul-29-2018 USD USD 5,8370 6,615.0 0,107.0 8.691.0 8476 0 5,837.0 6,615.0 8,107.0 8,691.0 8,476.0 5.683.0 3,008.0 5,6620 2.814.0 3.391.0 4,154.0 5,396 0 2,446.0 2,461.0 2,/11.0 1,090 0 93.0 1.177.0 91.0 1,383 0 88 0 1,519.0 92 0 1.386.0 84.0 (240 0) (211.0) 123 0 106.0 (266 0) 1,594.0 1,717.0 1,204. 943.0 1,057.0 1,503.0 1,404.0 1,117.0 1,291.0 1,610.0 (345.0) (183.0) 30 (180.0) (356 0) 20 (210.0) 10 (209.0) (115.0) 4.0 (115.0) p54.0) (341.0) (15.0) 1.0 (2.0) (1.0) 1.373.0 1,225.0 763.0 948.0 1,400.0 EBT Excl Unusual tems 40 41 Restructunng Charges 42 Merger & Related Restruct Charges 43 Impairment of Goodwill 44 Gain (Less) On Sale Of Invest 45 Gain (Loss) On Sale Of Assets 46 Asset Witedown 47 Legal Settlements 48 Other Unusual Itema 49 EBT Inct. Unusual Items 50 (48.0) (202.0) (107 0) (121.0) (69.0) (53.0) (49.0) (64.0) (9.0) (10.0) (10) (11.0) (54.0) (22 0) (16 0) 1,316.0 830.0 625.0 766.0 1,336.0 Income Statement Balance Sheet Cash Flow A 36 37 Curency Exchange Gans (Loss) 38 Other Non-Operating Inc (Exp ) 39 EBT Excl. Unusual Items 40 41 Restructuring Charges 42 Merger & Related Restruct Charges 43 Impairment of Goodwill 44 Gan (Loss) On Sale Of invest (15.0) 1.0 (20) (10) 1,373.0 1,225.0 763.0 548.0 1,400.0 (202. 0) (107.0) (48.0) (121.0) (69.0) (53 0) (9.0) (10 0) (10) 45 Gain (Loss) On Sale Of Assets 46 Asset Writedown (49 0) (64 0) (11 0) (54.0) (22.0) (16.0) 47 Legal Settiements 48 Other Unusual items 49 EBT Incl. Unusual Items 50 51 Income Tax Expense 52 Earnings from Cont. Ops. 53 54 Eamings of Discontinued Ops 55 Extraord. Item & Account. Change 56 1,316.0 830.0 625.0 766.0 1,336.0 392.0 924.0 106.0 724.0 151.0 474.0 174.0 328.0 1,008.0 592.0 (37.0) (463.0) (263.0) 1,036.0 (6.0) Net Income to Company 57 58 Minority Int in Eamings 887.0 261.0 211.0 1,628.0 1,002.0 59 Net Income 887.0 261.0 211.0 1.628.0 1.002.0 60 61 Balance Sheet as of 14 Reclassified Jul 29.2018 Jul-30 2017 Jul-28 2019 USD Aug 02.2020 USO Aug 01 2021 USD 15 Currency 16 ASSETS 17 Cash And Equivalents 18 Total Cash & ST Investments 19 20 Accounts Receable 21 Other Receivaties 22 Total Receivables 23 24 ventery 25 Other Current Assets 20 Total Current Assets 27 28 Gross Property, Plant & Equipment 29 Accumulated Depreciation 30 Net Property, Plant & Equipment 31 32 Long term investments 33 Goodwill 34 other Intangibles 35 Defered Tax Assets, LT 36 Other Long-Term Assets 37 Total Assets 38 39 LIABILITIES 40 Accounts Payable 41 Accrued Exp 42 Short term Bortowings 43 Cun. Port of LT Debt 44 Cur Port. of Leases 45 Curr Income Taxes Payatle 46 Other Current Liablities 47 USD USD 319.0 319.0 49 0 49.0 31.0 31.0 859 0 859.0 69.0 69.0 550.0 530.0 45 0 510 0 526 0 53.0 563.0 544 0 51.0 595.0 49.0 605.0 574.0 575.0 902 0 74 0 1,900.0 B87 0 797 0 2,296.0 863 0 499.0 871.0 800 2,165.0 9330 96 0 1,695.0 1,967.0 6,043.0 3509 0) 2,454.0 5216 0 (2.760.0) 2455.0 5,724.0 0.119.0) 2,605.0 5,539 0 5,29 0 2.773.0) 2,466.0 2,622.0 690 2.115.0 1,118 0 36 0 34.0 92.0 3,864 0 3.664 0 17.0 4,0170 3415.0 3,986 0 3.350 0 3.901.0 3.239 0 20 2,145 0 14.529.0 1217.0 13.148.0 29.0 SP372.0 214.0 11.734.0 1.126.0 814.0 572.0 1,070 0 513.0 37.0 666 0 494 0 1.036 0 22.0 1.0 1,049 0 603.0 278.0 921.0 70 0 24.0 705 0 494 0 1,135 0 390 0 850.0 500 0 210 15.0 20.0 156 0 2,395.0 10.0 860 0 3,594.0 65.0 5.0 124.0 613.0 130.0 3,385.0 3,075.0 1,814.0 Total Current Liabilities 48 49 Long-Term Debt 50 Long-Term Leases 51 Pension & Other Post-Retire Benefits 52 Det. Tax Liablity, Non-Cur 4.990.0 188.0 4620 5.002 0 188.0 7.991 0 7.101.0 24920 70 20 389 0 924 0 341.0 508 0 4900 347.0 960 0 9140 1,051.0 Income Statement Balance Sheet Cash Flow B C. D. F 38 39 LIABILITIES -40 Accounts Payable 41 Accrued Exp. 42 Short term Borrowings 43 Curr Port of LT Debt 44 Cun Port of Leases 45 Cun Income Taxes Payable 46 Other Current Liabilities -47 666.0 494.0 1,036 0 22.0 705 0 494 0 814 0 572.0 850 0 1,049.0 603.0 278 0 921.0 1,070.0 513.0 37.0 1.135.0 390.0 5000 21.0 1.0 70.0 24.0 65.0 20.0 156.0 10.0 15.0 860 0 3,594.0 613.0 3,385.0 130.0 3,075.0 5.0 124.0 1,814.0 Total Current Liabilities 48 49 Long Term Debt 50 Long-Term Leases 51 Pension & Other Post Retire. Benefits 52 Def Tax Liability, Non-Cum 53 Jother Non Current Liabilities 54 Total Liabilities 55 56 Common Stock 57 Additional Paid in Capital 58 Retained Eamings 59 Treasury Stock 60 Comprehensve Inc and Other 61 2,395.0 2492.0 7.0 508 0 7.991.0 7.101 0 4,990.0 188.0 462.0 5,002. 0 188 0 2.0 389.0 924.0 235.0 12.036.0 347.0 341.0 1,051.0 184.0 8,580.0 490.0 189.0 960.0 264.0 914.0 174,0 9,803.0 6,081.0 13,156.0 120 12.0 349.0 120 3720 12.0 394.0 12.0 359 0 2,385 0 (1,066.0) (53 0) 1,637.0 2.224.0 (1.103 0) (118 0) 1,364.0 1,993 0 (1.076 0) (198 O) 1,103.0 3,190 0 (1,023.0) (10.0) 2,563.0 414.0 3,742.0 (1,021.0) 5.0 3,152.0 Total Common Equity 62 63 Minonty Interest 64 65 Total Equity 66 67 Total Liabilities And Equity 68 69 Supplemental Items 70 Total Shares Out. on Balance Sheet Date 71 72 Market Price of Stock 73 74 75 76 77 8.0 9.0 9.0 60 20 1.645.0 1.373.0 1.112.0 2.569.0 3.154.0 L.126.0 14,529.0 13.148.0 12.372.0 11.74.0 3010 301.0 301.0 302 0 302 0 S46.20 $39 45 $45.00 $52 61 541.73 78 Income Statement Balance Sheet Cash Flow 13 Cash Flow Restated 12 months Jul-30 2017 Restated 12 months Jul 29.2018 Restated 12 months Restated For the Fiscal Period Ending 14 15 Currency 16 17 Net lecome 18 Depreciation & Amort 19 Amot of Goodwill and Intangibles 20 Depreciation & Amort., Total 21 22 (Gan) Loss From Sale Of Assets 23 Gan) Loss On Sale Of Invest 24 Asset Witedown & Restructuring Costs 25 Stock-Based Compensation 26 Net Cash From Discontinued Ops 27 Other Operating Activities 28 Change in Ace. Receivatile 29 Change in bnentones 30 Change in Acc Payatle 31 Change in Other Net Operatirng Assets 32 Cash from Ops 33 34 Captal Eapenditure 35 Cash Acqusitions 36 Dvestitures 37 invest in Marketatie & Equity Securt 38 Net (Inc.) Dec in Loans Originated/Sold 39 Other Investing Activties 12 months 12 months Aug 02.2020 USD Jul 28.2019 Aug 01 2021 USD USD USD USD 887.0 261.0 211.0 1,628.0 285.0 1,002.0 192.0 259.0 20.0 279.0 315.0 480 275.0 420 10 43.0 328.0 193.0 363.0 317.0 32.0 1.0 470 (975 0) 490 9.0 11.0 10 0 18.0 116.0 60.0 205 0 610 914 0 58.0 312.0 77.0 21.0 640 610 (206 0) 28.0 46 0 (48. 0) (308.0) 56.0 (14 0) 78.0 270 1,410.0 204 0 (91.0) (11 0) 36 0 (30 0) (20 0) 145 0 (7 0) (164 0) 125 0 (1.0) 1,250.0 1,236.0 1.396.0 1,035.0 (407.0) (6,781.0) 10 0 (384 0) (47 0) 310 (299.0) (11 0) 2,548 0 300 (275 0 (20) 1110 00.0) (368.0) (19.0) (7,197.0) 553.0 153.0 4.0 Cash from Investing 80 (158.0) 40 2,272.0 41 42 Short Term Dett isaued 43 Lang-Turm Debt tsvued 44 Total Debt Issued 45 Shot Term Debt Repaid 46 Long Term Debt Repaid 47 Total Debt Repaid 48 49 Issuance of Common Stock 50 Repurchase of Common Stock 51 8,247.0 2110 10 222.0 6.224 0 16,446.0 (9.544.0) 63 0) (10,007.0) 5.839 0 5.6170 1.000 0 6,617.0 (6,909 0 2.268 0) 9.177.0) 320.0 8,458.0 5,839.0 320.0 (8,002 0) (490.0) (8,492.0) (6.296 0) (702 0) (6.998.0) (580 0) (921 0) (1,501.0) 2.0 (109 0) 23.0 (12.0) 20 (51.0) (459.0) (80) Income Statement Balance Sheet Cash Flow A B 40 Cash from Investing 41 42 Short Term Debt Issued 43 Long Term Debt Issued 44 Total Debt Issued 45 Shart Term Dett Repaid 46 Long-Term Debt Repaid 47 Total Debt Repaid 48 49 issuance of Common Stock 50 Repurchase of Common Stock 51 52 Common Dividends Paid 53 Total Dividends Paid 54 55 Special Dividend Paid 56 Other Financing Activties 57 (368.0) (7,197.0) 153.0 2.2/2.0 (158.0) 8,2470 2110 8,458.0 (8.002 0) (490 0) (8,492.0) 10,222.0 6.224.0 16,446.0 5,839.0 5,6170 1,0000 320.0 5,839.0 (6.296.0) (702 0) (6,998.0) 6,617.0 320.0 (9,944 0) (63.0) (10,007.0) (6,909.0) (2.268 0) (9,177.0) (580 0) (921.0) (1,501.0) 20 23.0 20 (459.0) (109 0) (8.0) (12.0) (51.0) (420.0) (420.0) (426.0) (426.0) (423.0) (423.0) (426 0) (426.0) (439.0) (439.0) 3.0 (908.0) (97.0) 5,807.0 (1.0) (1,591.0) (12 0) (2,987.0) Cash from Financing 58 59 Foreign Exchange Rate Ad 60 (1,669.0) 11.0 (8.0) 12.0 (70) 1195.0 (1.0) 580.0 20 (790.01 Net Change in Cash 61 62 63 64 65 66 67 68 69 70 71 72 73 74 75 76 77 78 79 80 129.0) Income Statement Balance Sheet Cash Flow a.) What was Campbell's dividend payout ratio and retention ratio for each of the last five years (2017-2021) b.) What is the total cumulative common stock repurchases over the last five years (2017- 2021)? c.) Assume that at the end of 2021 Campbell's stock was trading at $41.73, and it declares a 3-for-1 stock split. What is the projected new stock price and the projected new shares outstanding. Reclassified 12 months Reclassified 12 months 12 months 12 months 12 months For the Fiscal Period Ending 14 15 Currency 16 17 Revenue 18 Other Revenue 19 Total Revenue 20 21 Cest Of Goods Sold 22 Gross Profit 23 24 Selling General & Admin Exp 25 R&DExp 26 Depreciation & Amart 27 Ofher Operating Exponseinceme) 28 29 Other Operating Exp., Total 30 31 Operating Income 32 33 Interest Expense :34 interest and Invest. Inceme 35 Net Interest Exp. 36 37 Cumency Exchange Gans (Los) 38 Other Non Operating Inc. (Exp) 39 Jul 28 2019 USD Aug-02-2020 USD Aug 01-2021 USD Jul 30-2017 Jul-29-2018 USD USD 5,8370 6,615.0 0,107.0 8.691.0 8476 0 5,837.0 6,615.0 8,107.0 8,691.0 8,476.0 5.683.0 3,008.0 5,6620 2.814.0 3.391.0 4,154.0 5,396 0 2,446.0 2,461.0 2,/11.0 1,090 0 93.0 1.177.0 91.0 1,383 0 88 0 1,519.0 92 0 1.386.0 84.0 (240 0) (211.0) 123 0 106.0 (266 0) 1,594.0 1,717.0 1,204. 943.0 1,057.0 1,503.0 1,404.0 1,117.0 1,291.0 1,610.0 (345.0) (183.0) 30 (180.0) (356 0) 20 (210.0) 10 (209.0) (115.0) 4.0 (115.0) p54.0) (341.0) (15.0) 1.0 (2.0) (1.0) 1.373.0 1,225.0 763.0 948.0 1,400.0 EBT Excl Unusual tems 40 41 Restructunng Charges 42 Merger & Related Restruct Charges 43 Impairment of Goodwill 44 Gain (Less) On Sale Of Invest 45 Gain (Loss) On Sale Of Assets 46 Asset Witedown 47 Legal Settlements 48 Other Unusual Itema 49 EBT Inct. Unusual Items 50 (48.0) (202.0) (107 0) (121.0) (69.0) (53.0) (49.0) (64.0) (9.0) (10.0) (10) (11.0) (54.0) (22 0) (16 0) 1,316.0 830.0 625.0 766.0 1,336.0 Income Statement Balance Sheet Cash Flow A 36 37 Curency Exchange Gans (Loss) 38 Other Non-Operating Inc (Exp ) 39 EBT Excl. Unusual Items 40 41 Restructuring Charges 42 Merger & Related Restruct Charges 43 Impairment of Goodwill 44 Gan (Loss) On Sale Of invest (15.0) 1.0 (20) (10) 1,373.0 1,225.0 763.0 548.0 1,400.0 (202. 0) (107.0) (48.0) (121.0) (69.0) (53 0) (9.0) (10 0) (10) 45 Gain (Loss) On Sale Of Assets 46 Asset Writedown (49 0) (64 0) (11 0) (54.0) (22.0) (16.0) 47 Legal Settiements 48 Other Unusual items 49 EBT Incl. Unusual Items 50 51 Income Tax Expense 52 Earnings from Cont. Ops. 53 54 Eamings of Discontinued Ops 55 Extraord. Item & Account. Change 56 1,316.0 830.0 625.0 766.0 1,336.0 392.0 924.0 106.0 724.0 151.0 474.0 174.0 328.0 1,008.0 592.0 (37.0) (463.0) (263.0) 1,036.0 (6.0) Net Income to Company 57 58 Minority Int in Eamings 887.0 261.0 211.0 1,628.0 1,002.0 59 Net Income 887.0 261.0 211.0 1.628.0 1.002.0 60 61 Balance Sheet as of 14 Reclassified Jul 29.2018 Jul-30 2017 Jul-28 2019 USD Aug 02.2020 USO Aug 01 2021 USD 15 Currency 16 ASSETS 17 Cash And Equivalents 18 Total Cash & ST Investments 19 20 Accounts Receable 21 Other Receivaties 22 Total Receivables 23 24 ventery 25 Other Current Assets 20 Total Current Assets 27 28 Gross Property, Plant & Equipment 29 Accumulated Depreciation 30 Net Property, Plant & Equipment 31 32 Long term investments 33 Goodwill 34 other Intangibles 35 Defered Tax Assets, LT 36 Other Long-Term Assets 37 Total Assets 38 39 LIABILITIES 40 Accounts Payable 41 Accrued Exp 42 Short term Bortowings 43 Cun. Port of LT Debt 44 Cur Port. of Leases 45 Curr Income Taxes Payatle 46 Other Current Liablities 47 USD USD 319.0 319.0 49 0 49.0 31.0 31.0 859 0 859.0 69.0 69.0 550.0 530.0 45 0 510 0 526 0 53.0 563.0 544 0 51.0 595.0 49.0 605.0 574.0 575.0 902 0 74 0 1,900.0 B87 0 797 0 2,296.0 863 0 499.0 871.0 800 2,165.0 9330 96 0 1,695.0 1,967.0 6,043.0 3509 0) 2,454.0 5216 0 (2.760.0) 2455.0 5,724.0 0.119.0) 2,605.0 5,539 0 5,29 0 2.773.0) 2,466.0 2,622.0 690 2.115.0 1,118 0 36 0 34.0 92.0 3,864 0 3.664 0 17.0 4,0170 3415.0 3,986 0 3.350 0 3.901.0 3.239 0 20 2,145 0 14.529.0 1217.0 13.148.0 29.0 SP372.0 214.0 11.734.0 1.126.0 814.0 572.0 1,070 0 513.0 37.0 666 0 494 0 1.036 0 22.0 1.0 1,049 0 603.0 278.0 921.0 70 0 24.0 705 0 494 0 1,135 0 390 0 850.0 500 0 210 15.0 20.0 156 0 2,395.0 10.0 860 0 3,594.0 65.0 5.0 124.0 613.0 130.0 3,385.0 3,075.0 1,814.0 Total Current Liabilities 48 49 Long-Term Debt 50 Long-Term Leases 51 Pension & Other Post-Retire Benefits 52 Det. Tax Liablity, Non-Cur 4.990.0 188.0 4620 5.002 0 188.0 7.991 0 7.101.0 24920 70 20 389 0 924 0 341.0 508 0 4900 347.0 960 0 9140 1,051.0 Income Statement Balance Sheet Cash Flow B C. D. F 38 39 LIABILITIES -40 Accounts Payable 41 Accrued Exp. 42 Short term Borrowings 43 Curr Port of LT Debt 44 Cun Port of Leases 45 Cun Income Taxes Payable 46 Other Current Liabilities -47 666.0 494.0 1,036 0 22.0 705 0 494 0 814 0 572.0 850 0 1,049.0 603.0 278 0 921.0 1,070.0 513.0 37.0 1.135.0 390.0 5000 21.0 1.0 70.0 24.0 65.0 20.0 156.0 10.0 15.0 860 0 3,594.0 613.0 3,385.0 130.0 3,075.0 5.0 124.0 1,814.0 Total Current Liabilities 48 49 Long Term Debt 50 Long-Term Leases 51 Pension & Other Post Retire. Benefits 52 Def Tax Liability, Non-Cum 53 Jother Non Current Liabilities 54 Total Liabilities 55 56 Common Stock 57 Additional Paid in Capital 58 Retained Eamings 59 Treasury Stock 60 Comprehensve Inc and Other 61 2,395.0 2492.0 7.0 508 0 7.991.0 7.101 0 4,990.0 188.0 462.0 5,002. 0 188 0 2.0 389.0 924.0 235.0 12.036.0 347.0 341.0 1,051.0 184.0 8,580.0 490.0 189.0 960.0 264.0 914.0 174,0 9,803.0 6,081.0 13,156.0 120 12.0 349.0 120 3720 12.0 394.0 12.0 359 0 2,385 0 (1,066.0) (53 0) 1,637.0 2.224.0 (1.103 0) (118 0) 1,364.0 1,993 0 (1.076 0) (198 O) 1,103.0 3,190 0 (1,023.0) (10.0) 2,563.0 414.0 3,742.0 (1,021.0) 5.0 3,152.0 Total Common Equity 62 63 Minonty Interest 64 65 Total Equity 66 67 Total Liabilities And Equity 68 69 Supplemental Items 70 Total Shares Out. on Balance Sheet Date 71 72 Market Price of Stock 73 74 75 76 77 8.0 9.0 9.0 60 20 1.645.0 1.373.0 1.112.0 2.569.0 3.154.0 L.126.0 14,529.0 13.148.0 12.372.0 11.74.0 3010 301.0 301.0 302 0 302 0 S46.20 $39 45 $45.00 $52 61 541.73 78 Income Statement Balance Sheet Cash Flow 13 Cash Flow Restated 12 months Jul-30 2017 Restated 12 months Jul 29.2018 Restated 12 months Restated For the Fiscal Period Ending 14 15 Currency 16 17 Net lecome 18 Depreciation & Amort 19 Amot of Goodwill and Intangibles 20 Depreciation & Amort., Total 21 22 (Gan) Loss From Sale Of Assets 23 Gan) Loss On Sale Of Invest 24 Asset Witedown & Restructuring Costs 25 Stock-Based Compensation 26 Net Cash From Discontinued Ops 27 Other Operating Activities 28 Change in Ace. Receivatile 29 Change in bnentones 30 Change in Acc Payatle 31 Change in Other Net Operatirng Assets 32 Cash from Ops 33 34 Captal Eapenditure 35 Cash Acqusitions 36 Dvestitures 37 invest in Marketatie & Equity Securt 38 Net (Inc.) Dec in Loans Originated/Sold 39 Other Investing Activties 12 months 12 months Aug 02.2020 USD Jul 28.2019 Aug 01 2021 USD USD USD USD 887.0 261.0 211.0 1,628.0 285.0 1,002.0 192.0 259.0 20.0 279.0 315.0 480 275.0 420 10 43.0 328.0 193.0 363.0 317.0 32.0 1.0 470 (975 0) 490 9.0 11.0 10 0 18.0 116.0 60.0 205 0 610 914 0 58.0 312.0 77.0 21.0 640 610 (206 0) 28.0 46 0 (48. 0) (308.0) 56.0 (14 0) 78.0 270 1,410.0 204 0 (91.0) (11 0) 36 0 (30 0) (20 0) 145 0 (7 0) (164 0) 125 0 (1.0) 1,250.0 1,236.0 1.396.0 1,035.0 (407.0) (6,781.0) 10 0 (384 0) (47 0) 310 (299.0) (11 0) 2,548 0 300 (275 0 (20) 1110 00.0) (368.0) (19.0) (7,197.0) 553.0 153.0 4.0 Cash from Investing 80 (158.0) 40 2,272.0 41 42 Short Term Dett isaued 43 Lang-Turm Debt tsvued 44 Total Debt Issued 45 Shot Term Debt Repaid 46 Long Term Debt Repaid 47 Total Debt Repaid 48 49 Issuance of Common Stock 50 Repurchase of Common Stock 51 8,247.0 2110 10 222.0 6.224 0 16,446.0 (9.544.0) 63 0) (10,007.0) 5.839 0 5.6170 1.000 0 6,617.0 (6,909 0 2.268 0) 9.177.0) 320.0 8,458.0 5,839.0 320.0 (8,002 0) (490.0) (8,492.0) (6.296 0) (702 0) (6.998.0) (580 0) (921 0) (1,501.0) 2.0 (109 0) 23.0 (12.0) 20 (51.0) (459.0) (80) Income Statement Balance Sheet Cash Flow A B 40 Cash from Investing 41 42 Short Term Debt Issued 43 Long Term Debt Issued 44 Total Debt Issued 45 Shart Term Dett Repaid 46 Long-Term Debt Repaid 47 Total Debt Repaid 48 49 issuance of Common Stock 50 Repurchase of Common Stock 51 52 Common Dividends Paid 53 Total Dividends Paid 54 55 Special Dividend Paid 56 Other Financing Activties 57 (368.0) (7,197.0) 153.0 2.2/2.0 (158.0) 8,2470 2110 8,458.0 (8.002 0) (490 0) (8,492.0) 10,222.0 6.224.0 16,446.0 5,839.0 5,6170 1,0000 320.0 5,839.0 (6.296.0) (702 0) (6,998.0) 6,617.0 320.0 (9,944 0) (63.0) (10,007.0) (6,909.0) (2.268 0) (9,177.0) (580 0) (921.0) (1,501.0) 20 23.0 20 (459.0) (109 0) (8.0) (12.0) (51.0) (420.0) (420.0) (426.0) (426.0) (423.0) (423.0) (426 0) (426.0) (439.0) (439.0) 3.0 (908.0) (97.0) 5,807.0 (1.0) (1,591.0) (12 0) (2,987.0) Cash from Financing 58 59 Foreign Exchange Rate Ad 60 (1,669.0) 11.0 (8.0) 12.0 (70) 1195.0 (1.0) 580.0 20 (790.01 Net Change in Cash 61 62 63 64 65 66 67 68 69 70 71 72 73 74 75 76 77 78 79 80 129.0) Income Statement Balance Sheet Cash Flow a.) What was Campbell's dividend payout ratio and retention ratio for each of the last five years (2017-2021) b.) What is the total cumulative common stock repurchases over the last five years (2017- 2021)? c.) Assume that at the end of 2021 Campbell's stock was trading at $41.73, and it declares a 3-for-1 stock split. What is the projected new stock price and the projected new shares outstanding. Reclassified 12 months Reclassified 12 months 12 months 12 months 12 months For the Fiscal Period Ending 14 15 Currency 16 17 Revenue 18 Other Revenue 19 Total Revenue 20 21 Cest Of Goods Sold 22 Gross Profit 23 24 Selling General & Admin Exp 25 R&DExp 26 Depreciation & Amart 27 Ofher Operating Exponseinceme) 28 29 Other Operating Exp., Total 30 31 Operating Income 32 33 Interest Expense :34 interest and Invest. Inceme 35 Net Interest Exp. 36 37 Cumency Exchange Gans (Los) 38 Other Non Operating Inc. (Exp) 39 Jul 28 2019 USD Aug-02-2020 USD Aug 01-2021 USD Jul 30-2017 Jul-29-2018 USD USD 5,8370 6,615.0 0,107.0 8.691.0 8476 0 5,837.0 6,615.0 8,107.0 8,691.0 8,476.0 5.683.0 3,008.0 5,6620 2.814.0 3.391.0 4,154.0 5,396 0 2,446.0 2,461.0 2,/11.0 1,090 0 93.0 1.177.0 91.0 1,383 0 88 0 1,519.0 92 0 1.386.0 84.0 (240 0) (211.0) 123 0 106.0 (266 0) 1,594.0 1,717.0 1,204. 943.0 1,057.0 1,503.0 1,404.0 1,117.0 1,291.0 1,610.0 (345.0) (183.0) 30 (180.0) (356 0) 20 (210.0) 10 (209.0) (115.0) 4.0 (115.0) p54.0) (341.0) (15.0) 1.0 (2.0) (1.0) 1.373.0 1,225.0 763.0 948.0 1,400.0 EBT Excl Unusual tems 40 41 Restructunng Charges 42 Merger & Related Restruct Charges 43 Impairment of Goodwill 44 Gain (Less) On Sale Of Invest 45 Gain (Loss) On Sale Of Assets 46 Asset Witedown 47 Legal Settlements 48 Other Unusual Itema 49 EBT Inct. Unusual Items 50 (48.0) (202.0) (107 0) (121.0) (69.0) (53.0) (49.0) (64.0) (9.0) (10.0) (10) (11.0) (54.0) (22 0) (16 0) 1,316.0 830.0 625.0 766.0 1,336.0 Income Statement Balance Sheet Cash Flow A 36 37 Curency Exchange Gans (Loss) 38 Other Non-Operating Inc (Exp ) 39 EBT Excl. Unusual Items 40 41 Restructuring Charges 42 Merger & Related Restruct Charges 43 Impairment of Goodwill 44 Gan (Loss) On Sale Of invest (15.0) 1.0 (20) (10) 1,373.0 1,225.0 763.0 548.0 1,400.0 (202. 0) (107.0) (48.0) (121.0) (69.0) (53 0) (9.0) (10 0) (10) 45 Gain (Loss) On Sale Of Assets 46 Asset Writedown (49 0) (64 0) (11 0) (54.0) (22.0) (16.0) 47 Legal Settiements 48 Other Unusual items 49 EBT Incl. Unusual Items 50 51 Income Tax Expense 52 Earnings from Cont. Ops. 53 54 Eamings of Discontinued Ops 55 Extraord. Item & Account. Change 56 1,316.0 830.0 625.0 766.0 1,336.0 392.0 924.0 106.0 724.0 151.0 474.0 174.0 328.0 1,008.0 592.0 (37.0) (463.0) (263.0) 1,036.0 (6.0) Net Income to Company 57 58 Minority Int in Eamings 887.0 261.0 211.0 1,628.0 1,002.0 59 Net Income 887.0 261.0 211.0 1.628.0 1.002.0 60 61 Balance Sheet as of 14 Reclassified Jul 29.2018 Jul-30 2017 Jul-28 2019 USD Aug 02.2020 USO Aug 01 2021 USD 15 Currency 16 ASSETS 17 Cash And Equivalents 18 Total Cash & ST Investments 19 20 Accounts Receable 21 Other Receivaties 22 Total Receivables 23 24 ventery 25 Other Current Assets 20 Total Current Assets 27 28 Gross Property, Plant & Equipment 29 Accumulated Depreciation 30 Net Property, Plant & Equipment 31 32 Long term investments 33 Goodwill 34 other Intangibles 35 Defered Tax Assets, LT 36 Other Long-Term Assets 37 Total Assets 38 39 LIABILITIES 40 Accounts Payable 41 Accrued Exp 42 Short term Bortowings 43 Cun. Port of LT Debt 44 Cur Port. of Leases 45 Curr Income Taxes Payatle 46 Other Current Liablities 47 USD USD 319.0 319.0 49 0 49.0 31.0 31.0 859 0 859.0 69.0 69.0 550.0 530.0 45 0 510 0 526 0 53.0 563.0 544 0 51.0 595.0 49.0 605.0 574.0 575.0 902 0 74 0 1,900.0 B87 0 797 0 2,296.0 863 0 499.0 871.0 800 2,165.0 9330 96 0 1,695.0 1,967.0 6,043.0 3509 0) 2,454.0 5216 0 (2.760.0) 2455.0 5,724.0 0.119.0) 2,605.0 5,539 0 5,29 0 2.773.0) 2,466.0 2,622.0 690 2.115.0 1,118 0 36 0 34.0 92.0 3,864 0 3.664 0 17.0 4,0170 3415.0 3,986 0 3.350 0 3.901.0 3.239 0 20 2,145 0 14.529.0 1217.0 13.148.0 29.0 SP372.0 214.0 11.734.0 1.126.0 814.0 572.0 1,070 0 513.0 37.0 666 0 494 0 1.036 0 22.0 1.0 1,049 0 603.0 278.0 921.0 70 0 24.0 705 0 494 0 1,135 0 390 0 850.0 500 0 210 15.0 20.0 156 0 2,395.0 10.0 860 0 3,594.0 65.0 5.0 124.0 613.0 130.0 3,385.0 3,075.0 1,814.0 Total Current Liabilities 48 49 Long-Term Debt 50 Long-Term Leases 51 Pension & Other Post-Retire Benefits 52 Det. Tax Liablity, Non-Cur 4.990.0 188.0 4620 5.002 0 188.0 7.991 0 7.101.0 24920 70 20 389 0 924 0 341.0 508 0 4900 347.0 960 0 9140 1,051.0 Income Statement Balance Sheet Cash Flow B C. D. F 38 39 LIABILITIES -40 Accounts Payable 41 Accrued Exp. 42 Short term Borrowings 43 Curr Port of LT Debt 44 Cun Port of Leases 45 Cun Income Taxes Payable 46 Other Current Liabilities -47 666.0 494.0 1,036 0 22.0 705 0 494 0 814 0 572.0 850 0 1,049.0 603.0 278 0 921.0 1,070.0 513.0 37.0 1.135.0 390.0 5000 21.0 1.0 70.0 24.0 65.0 20.0 156.0 10.0 15.0 860 0 3,594.0 613.0 3,385.0 130.0 3,075.0 5.0 124.0 1,814.0 Total Current Liabilities 48 49 Long Term Debt 50 Long-Term Leases 51 Pension & Other Post Retire. Benefits 52 Def Tax Liability, Non-Cum 53 Jother Non Current Liabilities 54 Total Liabilities 55 56 Common Stock 57 Additional Paid in Capital 58 Retained Eamings 59 Treasury Stock 60 Comprehensve Inc and Other 61 2,395.0 2492.0 7.0 508 0 7.991.0 7.101 0 4,990.0 188.0 462.0 5,002. 0 188 0 2.0 389.0 924.0 235.0 12.036.0 347.0 341.0 1,051.0 184.0 8,580.0 490.0 189.0 960.0 264.0 914.0 174,0 9,803.0 6,081.0 13,156.0 120 12.0 349.0 120 3720 12.0 394.0 12.0 359 0 2,385 0 (1,066.0) (53 0) 1,637.0 2.224.0 (1.103 0) (118 0) 1,364.0 1,993 0 (1.076 0) (198 O) 1,103.0 3,190 0 (1,023.0) (10.0) 2,563.0 414.0 3,742.0 (1,021.0) 5.0 3,152.0 Total Common Equity 62 63 Minonty Interest 64 65 Total Equity 66 67 Total Liabilities And Equity 68 69 Supplemental Items 70 Total Shares Out. on Balance Sheet Date 71 72 Market Price of Stock 73 74 75 76 77 8.0 9.0 9.0 60 20 1.645.0 1.373.0 1.112.0 2.569.0 3.154.0 L.126.0 14,529.0 13.148.0 12.372.0 11.74.0 3010 301.0 301.0 302 0 302 0 S46.20 $39 45 $45.00 $52 61 541.73 78 Income Statement Balance Sheet Cash Flow 13 Cash Flow Restated 12 months Jul-30 2017 Restated 12 months Jul 29.2018 Restated 12 months Restated For the Fiscal Period Ending 14 15 Currency 16 17 Net lecome 18 Depreciation & Amort 19 Amot of Goodwill and Intangibles 20 Depreciation & Amort., Total 21 22 (Gan) Loss From Sale Of Assets 23 Gan) Loss On Sale Of Invest 24 Asset Witedown & Restructuring Costs 25 Stock-Based Compensation 26 Net Cash From Discontinued Ops 27 Other Operating Activities 28 Change in Ace. Receivatile 29 Change in bnentones 30 Change in Acc Payatle 31 Change in Other Net Operatirng Assets 32 Cash from Ops 33 34 Captal Eapenditure 35 Cash Acqusitions 36 Dvestitures 37 invest in Marketatie & Equity Securt 38 Net (Inc.) Dec in Loans Originated/Sold 39 Other Investing Activties 12 months 12 months Aug 02.2020 USD Jul 28.2019 Aug 01 2021 USD USD USD USD 887.0 261.0 211.0 1,628.0 285.0 1,002.0 192.0 259.0 20.0 279.0 315.0 480 275.0 420 10 43.0 328.0 193.0 363.0 317.0 32.0 1.0 470 (975 0) 490 9.0 11.0 10 0 18.0 116.0 60.0 205 0 610 914 0 58.0 312.0 77.0 21.0 640 610 (206 0) 28.0 46 0 (48. 0) (308.0) 56.0 (14 0) 78.0 270 1,410.0 204 0 (91.0) (11 0) 36 0 (30 0) (20 0) 145 0 (7 0) (164 0) 125 0 (1.0) 1,250.0 1,236.0 1.396.0 1,035.0 (407.0) (6,781.0) 10 0 (384 0) (47 0) 310 (299.0) (11 0) 2,548 0 300 (275 0 (20) 1110 00.0) (368.0) (19.0) (7,197.0) 553.0 153.0 4.0 Cash from Investing 80 (158.0) 40 2,272.0 41 42 Short Term Dett isaued 43 Lang-Turm Debt tsvued 44 Total Debt Issued 45 Shot Term Debt Repaid 46 Long Term Debt Repaid 47 Total Debt Repaid 48 49 Issuance of Common Stock 50 Repurchase of Common Stock 51 8,247.0 2110 10 222.0 6.224 0 16,446.0 (9.544.0) 63 0) (10,007.0) 5.839 0 5.6170 1.000 0 6,617.0 (6,909 0 2.268 0) 9.177.0) 320.0 8,458.0 5,839.0 320.0 (8,002 0) (490.0) (8,492.0) (6.296 0) (702 0) (6.998.0) (580 0) (921 0) (1,501.0) 2.0 (109 0) 23.0 (12.0) 20 (51.0) (459.0) (80) Income Statement Balance Sheet Cash Flow A B 40 Cash from Investing 41 42 Short Term Debt Issued 43 Long Term Debt Issued 44 Total Debt Issued 45 Shart Term Dett Repaid 46 Long-Term Debt Repaid 47 Total Debt Repaid 48 49 issuance of Common Stock 50 Repurchase of Common Stock 51 52 Common Dividends Paid 53 Total Dividends Paid 54 55 Special Dividend Paid 56 Other Financing Activties 57 (368.0) (7,197.0) 153.0 2.2/2.0 (158.0) 8,2470 2110 8,458.0 (8.002 0) (490 0) (8,492.0) 10,222.0 6.224.0 16,446.0 5,839.0 5,6170 1,0000 320.0 5,839.0 (6.296.0) (702 0) (6,998.0) 6,617.0 320.0 (9,944 0) (63.0) (10,007.0) (6,909.0) (2.268 0) (9,177.0) (580 0) (921.0) (1,501.0) 20 23.0 20 (459.0) (109 0) (8.0) (12.0) (51.0) (420.0) (420.0) (426.0) (426.0) (423.0) (423.0) (426 0) (426.0) (439.0) (439.0) 3.0 (908.0) (97.0) 5,807.0 (1.0) (1,591.0) (12 0) (2,987.0) Cash from Financing 58 59 Foreign Exchange Rate Ad 60 (1,669.0) 11.0 (8.0) 12.0 (70) 1195.0 (1.0) 580.0 20 (790.01 Net Change in Cash 61 62 63 64 65 66 67 68 69 70 71 72 73 74 75 76 77 78 79 80 129.0) Income Statement Balance Sheet Cash Flow a.) What was Campbell's dividend payout ratio and retention ratio for each of the last five years (2017-2021) b.) What is the total cumulative common stock repurchases over the last five years (2017- 2021)? c.) Assume that at the end of 2021 Campbell's stock was trading at $41.73, and it declares a 3-for-1 stock split. What is the projected new stock price and the projected new shares outstanding. Reclassified 12 months Reclassified 12 months 12 months 12 months 12 months For the Fiscal Period Ending 14 15 Currency 16 17 Revenue 18 Other Revenue 19 Total Revenue 20 21 Cest Of Goods Sold 22 Gross Profit 23 24 Selling General & Admin Exp 25 R&DExp 26 Depreciation & Amart 27 Ofher Operating Exponseinceme) 28 29 Other Operating Exp., Total 30 31 Operating Income 32 33 Interest Expense :34 interest and Invest. Inceme 35 Net Interest Exp. 36 37 Cumency Exchange Gans (Los) 38 Other Non Operating Inc. (Exp) 39 Jul 28 2019 USD Aug-02-2020 USD Aug 01-2021 USD Jul 30-2017 Jul-29-2018 USD USD 5,8370 6,615.0 0,107.0 8.691.0 8476 0 5,837.0 6,615.0 8,107.0 8,691.0 8,476.0 5.683.0 3,008.0 5,6620 2.814.0 3.391.0 4,154.0 5,396 0 2,446.0 2,461.0 2,/11.0 1,090 0 93.0 1.177.0 91.0 1,383 0 88 0 1,519.0 92 0 1.386.0 84.0 (240 0) (211.0) 123 0 106.0 (266 0) 1,594.0 1,717.0 1,204. 943.0 1,057.0 1,503.0 1,404.0 1,117.0 1,291.0 1,610.0 (345.0) (183.0) 30 (180.0) (356 0) 20 (210.0) 10 (209.0) (115.0) 4.0 (115.0) p54.0) (341.0) (15.0) 1.0 (2.0) (1.0) 1.373.0 1,225.0 763.0 948.0 1,400.0 EBT Excl Unusual tems 40 41 Restructunng Charges 42 Merger & Related Restruct Charges 43 Impairment of Goodwill 44 Gain (Less) On Sale Of Invest 45 Gain (Loss) On Sale Of Assets 46 Asset Witedown 47 Legal Settlements 48 Other Unusual Itema 49 EBT Inct. Unusual Items 50 (48.0) (202.0) (107 0) (121.0) (69.0) (53.0) (49.0) (64.0) (9.0) (10.0) (10) (11.0) (54.0) (22 0) (16 0) 1,316.0 830.0 625.0 766.0 1,336.0 Income Statement Balance Sheet Cash Flow A 36 37 Curency Exchange Gans (Loss) 38 Other Non-Operating Inc (Exp ) 39 EBT Excl. Unusual Items 40 41 Restructuring Charges 42 Merger & Related Restruct Charges 43 Impairment of Goodwill 44 Gan (Loss) On Sale Of invest (15.0) 1.0 (20) (10) 1,373.0 1,225.0 763.0 548.0 1,400.0 (202. 0) (107.0) (48.0) (121.0) (69.0) (53 0) (9.0) (10 0) (10) 45 Gain (Loss) On Sale Of Assets 46 Asset Writedown (49 0) (64 0) (11 0) (54.0) (22.0) (16.0) 47 Legal Settiements 48 Other Unusual items 49 EBT Incl. Unusual Items 50 51 Income Tax Expense 52 Earnings from Cont. Ops. 53 54 Eamings of Discontinued Ops 55 Extraord. Item & Account. Change 56 1,316.0 830.0 625.0 766.0 1,336.0 392.0 924.0 106.0 724.0 151.0 474.0 174.0 328.0 1,008.0 592.0 (37.0) (463.0) (263.0) 1,036.0 (6.0) Net Income to Company 57 58 Minority Int in Eamings 887.0 261.0 211.0 1,628.0 1,002.0 59 Net Income 887.0 261.0 211.0 1.628.0 1.002.0 60 61 Balance Sheet as of 14 Reclassified Jul 29.2018 Jul-30 2017 Jul-28 2019 USD Aug 02.2020 USO Aug 01 2021 USD 15 Currency 16 ASSETS 17 Cash And Equivalents 18 Total Cash & ST Investments 19 20 Accounts Receable 21 Other Receivaties 22 Total Receivables 23 24 ventery 25 Other Current Assets 20 Total Current Assets 27 28 Gross Property, Plant & Equipment 29 Accumulated Depreciation 30 Net Property, Plant & Equipment 31 32 Long term investments 33 Goodwill 34 other Intangibles 35 Defered Tax Assets, LT 36 Other Long-Term Assets 37 Total Assets 38 39 LIABILITIES 40 Accounts Payable 41 Accrued Exp 42 Short term Bortowings 43 Cun. Port of LT Debt 44 Cur Port. of Leases 45 Curr Income Taxes Payatle 46 Other Current Liablities 47 USD USD 319.0 319.0 49 0 49.0 31.0 31.0 859 0 859.0 69.0 69.0 550.0 530.0 45 0 510 0 526 0 53.0 563.0 544 0 51.0 595.0 49.0 605.0 574.0 575.0 902 0 74 0 1,900.0 B87 0 797 0 2,296.0 863 0 499.0 871.0 800 2,165.0 9330 96 0 1,695.0 1,967.0 6,043.0 3509 0) 2,454.0 5216 0 (2.760.0) 2455.0 5,724.0 0.119.0) 2,605.0 5,539 0 5,29 0 2.773.0) 2,466.0 2,622.0 690 2.115.0 1,118 0 36 0 34.0 92.0 3,864 0 3.664 0 17.0 4,0170 3415.0 3,986 0 3.350 0 3.901.0 3.239 0 20 2,145 0 14.529.0 1217.0 13.148.0 29.0 SP372.0 214.0 11.734.0 1.126.0 814.0 572.0 1,070 0 513.0 37.0 666 0 494 0 1.036 0 22.0 1.0 1,049 0 603.0 278.0 921.0 70 0 24.0 705 0 494 0 1,135 0 390 0 850.0 500 0 210 15.0 20.0 156 0 2,395.0 10.0 860 0 3,594.0 65.0 5.0 124.0 613.0 130.0 3,385.0 3,075.0 1,814.0 Total Current Liabilities 48 49 Long-Term Debt 50 Long-Term Leases 51 Pension & Other Post-Retire Benefits 52 Det. Tax Liablity, Non-Cur 4.990.0 188.0 4620 5.002 0 188.0 7.991 0 7.101.0 24920 70 20 389 0 924 0 341.0 508 0 4900 347.0 960 0 9140 1,051.0 Income Statement Balance Sheet Cash Flow B C. D. F 38 39 LIABILITIES -40 Accounts Payable 41 Accrued Exp. 42 Short term Borrowings 43 Curr Port of LT Debt 44 Cun Port of Leases 45 Cun Income Taxes Payable 46 Other Current Liabilities -47 666.0 494.0 1,036 0 22.0 705 0 494 0 814 0 572.0 850 0 1,049.0 603.0 278 0 921.0 1,070.0 513.0 37.0 1.135.0 390.0 5000 21.0 1.0 70.0 24.0 65.0 20.0 156.0 10.0 15.0 860 0 3,594.0 613.0 3,385.0 130.0 3,075.0 5.0 124.0 1,814.0 Total Current Liabilities 48 49 Long Term Debt 50 Long-Term Leases 51 Pension & Other Post Retire. Benefits 52 Def Tax Liability, Non-Cum 53 Jother Non Current Liabilities 54 Total Liabilities 55 56 Common Stock 57 Additional Paid in Capital 58 Retained Eamings 59 Treasury Stock 60 Comprehensve Inc and Other 61 2,395.0 2492.0 7.0 508 0 7.991.0 7.101 0 4,990.0 188.0 462.0 5,002. 0 188 0 2.0 389.0 924.0 235.0 12.036.0 347.0 341.0 1,051.0 184.0 8,580.0 490.0 189.0 960.0 264.0 914.0 174,0 9,803.0 6,081.0 13,156.0 120 12.0 349.0 120 3720 12.0 394.0 12.0 359 0 2,385 0 (1,066.0) (53 0) 1,637.0 2.224.0 (1.103 0) (118 0) 1,364.0 1,993 0 (1.076 0) (198 O) 1,103.0 3,190 0 (1,023.0) (10.0) 2,563.0 414.0 3,742.0 (1,021.0) 5.0 3,152.0 Total Common Equity 62 63 Minonty Interest 64 65 Total Equity 66 67 Total Liabilities And Equity 68 69 Supplemental Items 70 Total Shares Out. on Balance Sheet Date 71 72 Market Price of Stock 73 74 75 76 77 8.0 9.0 9.0 60 20 1.645.0 1.373.0 1.112.0 2.569.0 3.154.0 L.126.0 14,529.0 13.148.0 12.372.0 11.74.0 3010 301.0 301.0 302 0 302 0 S46.20 $39 45 $45.00 $52 61 541.73 78 Income Statement Balance Sheet Cash Flow 13 Cash Flow Restated 12 months Jul-30 2017 Restated 12 months Jul 29.2018 Restated 12 months Restated For the Fiscal Period Ending 14 15 Currency 16 17 Net lecome 18 Depreciation & Amort 19 Amot of Goodwill and Intangibles 20 Depreciation & Amort., Total 21 22 (Gan) Loss From Sale Of Assets 23 Gan) Loss On Sale Of Invest 24 Asset Witedown & Restructuring Costs 25 Stock-Based Compensation 26 Net Cash From Discontinued Ops 27 Other Operating Activities 28 Change in Ace. Receivatile 29 Change in bnentones 30 Change in Acc Payatle 31 Change in Other Net Operatirng Assets 32 Cash from Ops 33 34 Captal Eapenditure 35 Cash Acqusitions 36 Dvestitures 37 invest in Marketatie & Equity Securt 38 Net (Inc.) Dec in Loans Originated/Sold 39 Other Investing Activties 12 months 12 months Aug 02.2020 USD Jul 28.2019 Aug 01 2021 USD USD USD USD 887.0 261.0 211.0 1,628.0 285.0 1,002.0 192.0 259.0 20.0 279.0 315.0 480 275.0 420 10 43.0 328.0 193.0 363.0 317.0 32.0 1.0 470 (975 0) 490 9.0 11.0 10 0 18.0 116.0 60.0 205 0 610 914 0 58.0 312.0 77.0 21.0 640 610 (206 0) 28.0 46 0 (48. 0) (308.0) 56.0 (14 0) 78.0 270 1,410.0 204 0 (91.0) (11 0) 36 0 (30 0) (20 0) 145 0 (7 0) (164 0) 125 0 (1.0) 1,250.0 1,236.0 1.396.0 1,035.0 (407.0) (6,781.0) 10 0 (384 0) (47 0) 310 (299.0) (11 0) 2,548 0 300 (275 0 (20) 1110 00.0) (368.0) (19.0) (7,197.0) 553.0 153.0 4.0 Cash from Investing 80 (158.0) 40 2,272.0 41 42 Short Term Dett isaued 43 Lang-Turm Debt tsvued 44 Total Debt Issued 45 Shot Term Debt Repaid 46 Long Term Debt Repaid 47 Total Debt Repaid 48 49 Issuance of Common Stock 50 Repurchase of Common Stock 51 8,247.0 2110 10 222.0 6.224 0 16,446.0 (9.544.0) 63 0) (10,007.0) 5.839 0 5.6170 1.000 0 6,617.0 (6,909 0 2.268 0) 9.177.0) 320.0 8,458.0 5,839.0 320.0 (8,002 0) (490.0) (8,492.0) (6.296 0) (702 0) (6.998.0) (580 0) (921 0) (1,501.0) 2.0 (109 0) 23.0 (12.0) 20 (51.0) (459.0) (80) Income Statement Balance Sheet Cash Flow A B 40 Cash from Investing 41 42 Short Term Debt Issued 43 Long Term Debt Issued 44 Total Debt Issued 45 Shart Term Dett Repaid 46 Long-Term Debt Repaid 47 Total Debt Repaid 48 49 issuance of Common Stock 50 Repurchase of Common Stock 51 52 Common Dividends Paid 53 Total Dividends Paid 54 55 Special Dividend Paid 56 Other Financing Activties 57 (368.0) (7,197.0) 153.0 2.2/2.0 (158.0) 8,2470 2110 8,458.0 (8.002 0) (490 0) (8,492.0) 10,222.0 6.224.0 16,446.0 5,839.0 5,6170 1,0000 320.0 5,839.0 (6.296.0) (702 0) (6,998.0) 6,617.0 320.0 (9,944 0) (63.0) (10,007.0) (6,909.0) (2.268 0) (9,177.0) (580 0) (921.0) (1,501.0) 20 23.0 20 (459.0) (109 0) (8.0) (12.0) (51.0) (420.0) (420.0) (426.0) (426.0) (423.0) (423.0) (426 0) (426.0) (439.0) (439.0) 3.0 (908.0) (97.0) 5,807.0 (1.0) (1,591.0) (12 0) (2,987.0) Cash from Financing 58 59 Foreign Exchange Rate Ad 60 (1,669.0) 11.0 (8.0) 12.0 (70) 1195.0 (1.0) 580.0 20 (790.01 Net Change in Cash 61 62 63 64 65 66 67 68 69 70 71 72 73 74 75 76 77 78 79 80 129.0) Income Statement Balance Sheet Cash Flow
Expert Answer:
Answer rating: 100% (QA)
1 Year 2017 2018 2019 2020 2021 Net income 887 261 211 1... View the full answer

Posted Date:
Students also viewed these accounting questions
-
Assume that at the end of the accounting period there are credit balances of $3,400 in Patient Services Revenues and $1,800 in Laboratory Fees Revenues. Prepare the required closing entry. The...
-
For each of the following red flags, identify which fraud exposure the risk falls under: management and directors, relationships with others, organization and industry, or financial results and...
-
For each of the transactions listed in Test Yourself Question 3, what will be the ultimate effect on the money supply if the required reserve ratio is one-eighth (12.5 percent)? Assume that the...
-
Problem 9- 3A Estimating and reporting bad debts P2 At December 31, 2013, Hawke Company reports the following results for its calendar year. Cash sales . . . . . . . . . . $ 1,905,000 Credit sales ....
-
ELC Inc. sells all types of electronics with a one-year warranty for product assurance on all products sold. On 26 February, a customer came into the store and purchased a television for $ 1,250. The...
-
Diagram the sequence in which the following source document is prepared. a. Bill of Materials b. Work order c. Sales forecast d. Materials requisition e. Move ticket f. Production schedule g. Route...
-
Listed below are additional research questions and hypotheses from actual published articles. For each hypothesis, identify the independent and dependent variable. a. It is expected that achievement...
-
For each of the following accounts, indicate the effect of a debit or a credit on the account and the normal balance. (a) Accounts Payable. (b) Advertising Expense. (c) Service Revenue. (d) Accounts...
-
Elements of the Marketing sector in relation to the Real Estate industry in Marbella. Discuss the size of the sector, its economic importance to the industry in Marbella, number of people employed,...
-
Based in Winnipeg, Manitoba, Defence Electronics Inc. (DEI) was founded to provide security systems, facilities controls and related services. DEI established a solid reputation for quality and the...
-
When 27.8 mL of 0.500 M H2SO4 is added to 27.8 mL of 1.00 M KOH in a coffee-cup calorimeter at 23.50C, the temperature rises to 30.17C. Calculate H of this reaction. (Assume that the total volume is...
-
Kinesic interviewing is a technique used to study which of the following: a. A person's attitude. b. Structure of sentences. c. Content of statement. d. Observing body movements.
-
Determine the moments and axial forces in members of the frame in Figure 13.17, using the portal method. Compare the results with those produced by the cantilever method. 30 kips C B H 25'- D E F 12'...
-
Analyze the beam in Figure P14.4. After member end moments are determined, compute all reactions and draw the moment diagrams. \(E I\) is constant. A w = 12 kN/m 8 m- B 18 kN -3 m- 6 m C
-
What are the various types of trusts and when might they be used?
-
What is ambush marketing? Provide two or three examples of ambush marketing in sports.
-
Part B: (20 marks) Write a program according to these class diagram and output results. Booking.java -name: String -address: String -phone: String -price: Double -countBooking =0: static int...
-
What is the role of business risk analysis in the audit planning process?
-
Using the Harrison and Rubinfeld (1978) data published in Belsley, Kuh and Welsch (1980) and provided on the Springer website as Hedonic.xls, reproduce Table 9.1. Perform the Hausman test based on...
-
(a) Show that the variancecovariance matrix of the disturbances in (9.1) is given by (9.2). (b) Show that the two nonzero block matrices in (9.2) can be written as in (9.3). (c) Show that...
-
Consider the following unbalanced one-way analysis of variance model \[y_{i t}=\mu_{i}+u_{i t} \quad i=1, \ldots, N \quad t=1,2, \ldots, T_{i}\] where for simplicity's sake no explanatory variables...

Study smarter with the SolutionInn App