

Question: do a horizontal analysis on the first vertical analysis in the second table and trend analysis on the last one. make a horizontal analysis on
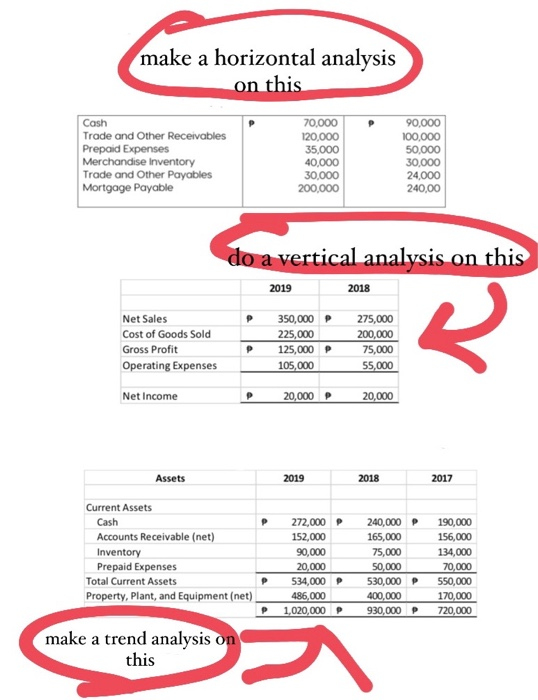
make a horizontal analysis on this Cash Trade and Other Receivables Prepaid Expenses Merchandise Inventory Trade and Other Payables Mortgage Payable 70,000 120,000 35,000 40,000 30,000 200,000 90,000 100,000 50,000 30,000 24,000 240,00 do a vertical analysis on this 2019 2018 P Net Sales Cost of Goods Sold Gross Profit Operating Expenses 350,000 225,000 125,000 ? 105,000 275,000 200,000 75,000 55,000 R P Net Income P 20,000 - 20,000 Assets 2019 2018 2017 P Current Assets Cash Accounts Receivable (net) Inventory Prepaid Expenses Total Current Assets Property, Plant, and Equipment (net) 272,000 P 152,000 90,000 20,000 534,000 P 486,000 1,020,000 P 240,000 P 165,000 75,000 50,000 530,000 P 400,000 930,000 P 190,000 156,000 134,000 70,000 550,000 170,000 720,000 P make a trend analysis on this
Step by Step Solution
There are 3 Steps involved in it

Get step-by-step solutions from verified subject matter experts