

Question: 4 Ploca graph of acceleration w total mass, uning the Part Il data. Basod on your aly the griph, what is the relationship between
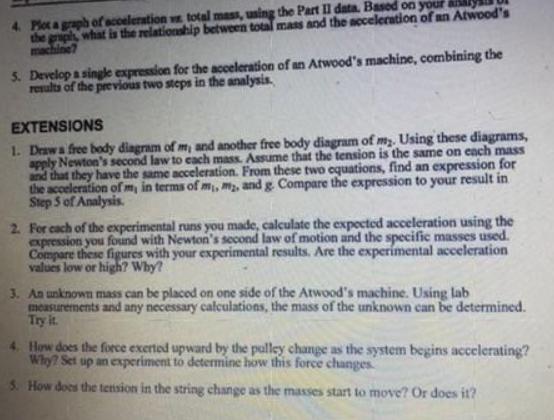
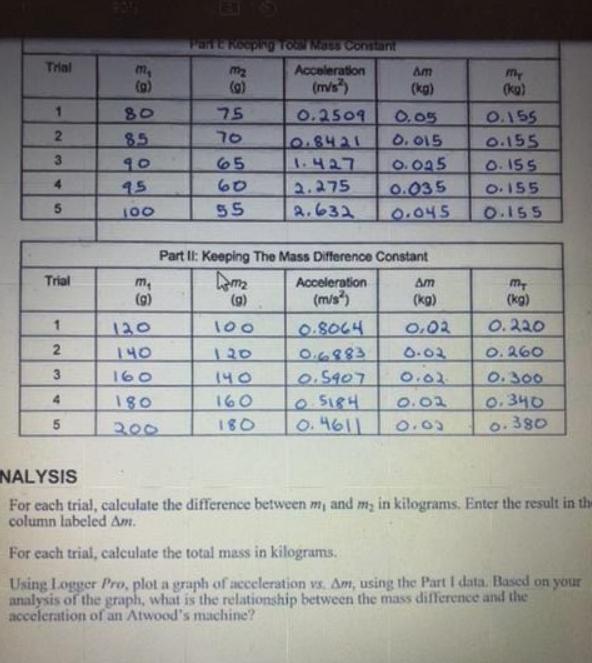
4 Ploca graph of acceleration w total mass, uning the Part Il data. Basod on your aly the griph, what is the relationship between total mass and the seceleration of an Atwood's machine? 5. Develop a single expression for the acceleration of an Atwood's machine, combining the results of the previous two steps in the analysis. EXTENSIONS 1. Drawa free body diagram of m, and another free body diagram of m Using these diagrams, apply Newton's second law to cach mass. Assume that the tension is the same on each mass and that they have the same acceleration. From these two equations, find an expression for the acceleration ofm, in terms of m, m2, and g Compare the expression to your result in Step S of Analysis. 2. For cach of the experimental runs you made, calculate the expected acceleration using the expression you fouund with Newton's second law of motion and the specific masses used. Compare these figures with your experimental results. Are the experimental acceleration values low or high? Why? 3. An unknown mass can be placed on one side of the Atwood's machine. Using lab measurements and any necessary calculations, the mass of the unknown can be determined. Try it. 4. How does the force exerted upward by the pulley change as the system begins accelerating? Why? Set up an experiment to determine how this force changes 3. How does the terision in the string change as the masses start to move? Or does it? PORE RoepiNg TOMas Constant Trial m, (g) m2 Acceleration Am (9) (m/s") (kg) my (ka) 1. 80 75 0.2509 0.05 O. 015 O.045 0.035 O.155 o.155 O. 155 2. 70 0.8421 1.427 85 3. 65 90 15 4. 60 5 . O155 5. 100 55 2.632 0.045 O.155 Part II: Keeping The Mass Difference Constant Trial Acceleration Am (g) (g) (m/s") (ka) (kg) 130 100 0.SOC4 0.02 0.220 140 120 0.6883 0.02 O. 260 O.5907 5184 0.4611 160 140 0.02 O. 300 0.340 o.380 4. 180 160 O.02 300 0.00 O81 NALYSIS For each trial, calculate the difference between m, and m; in kilograms. Enter the result in the column labeled Am. For each trial, calculate the total mass in kilograms. Using Logger Pro, plot a graph of acceleration vs. Am, using the Part I data. Based on your analysis of the graph, what is the relationship between the mass difference and the acceleration of an Atwood's machine?
Step by Step Solution
3.37 Rating (156 Votes )
There are 3 Steps involved in it

Get step-by-step solutions from verified subject matter experts