

Question: do all parts asap part 1 part 2 for reference question: part 3. part 4. this is the context Based on the information in the
 this is the context
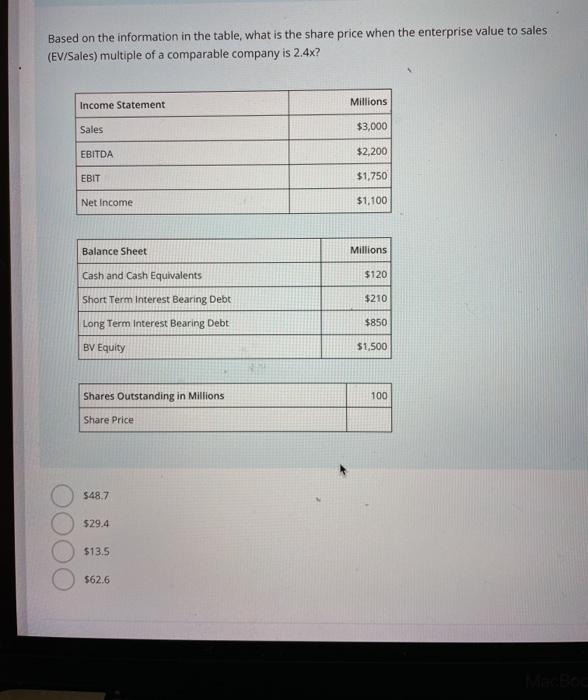
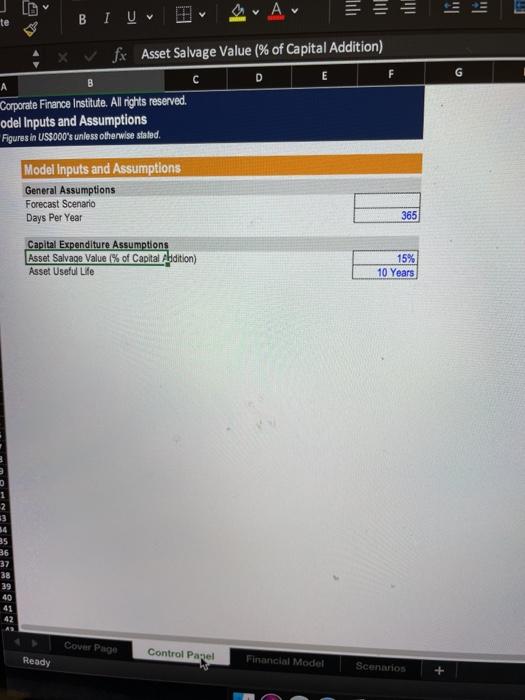
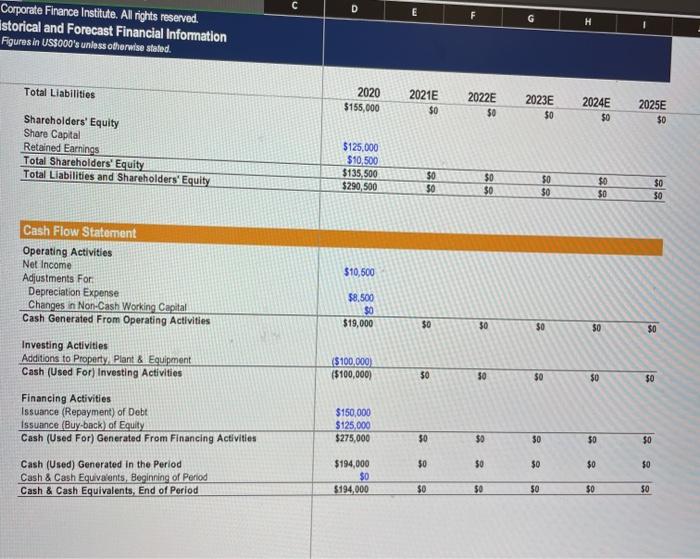
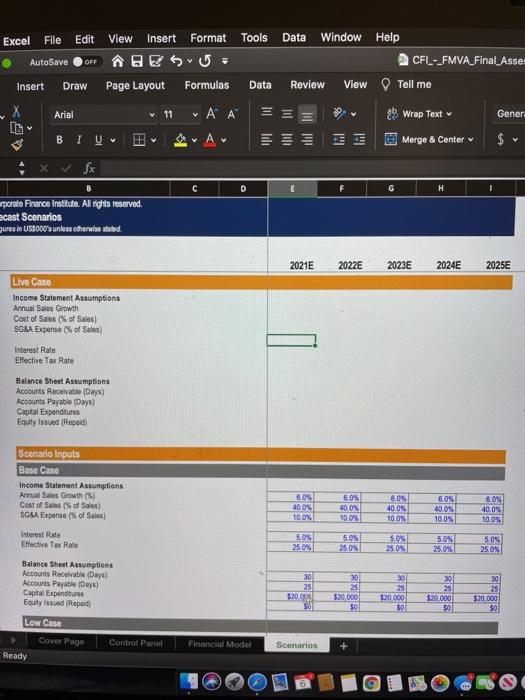
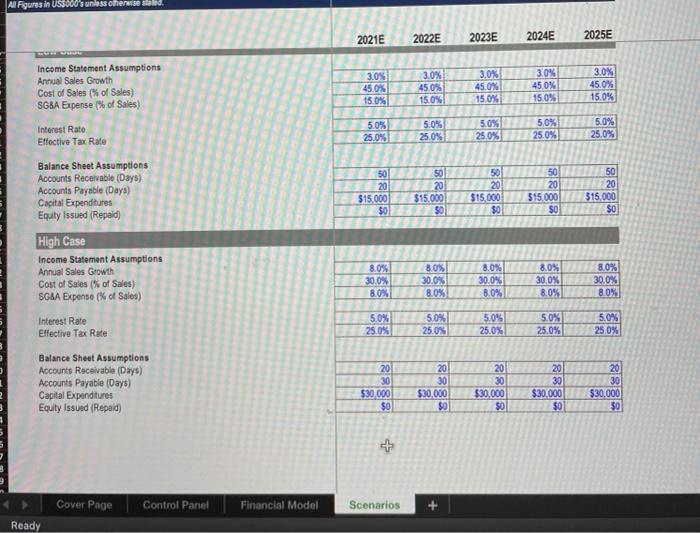
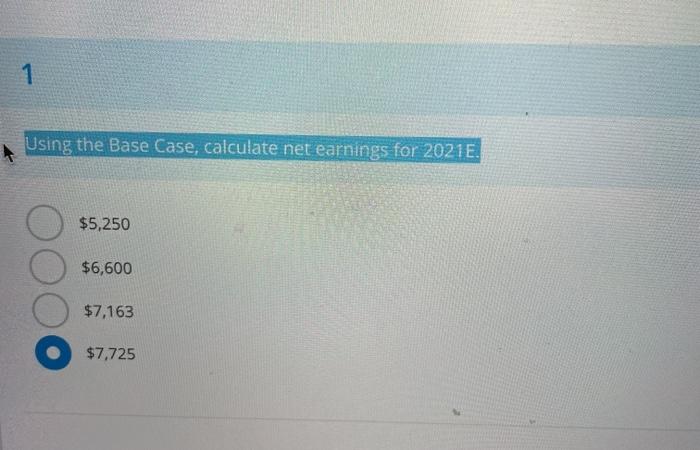
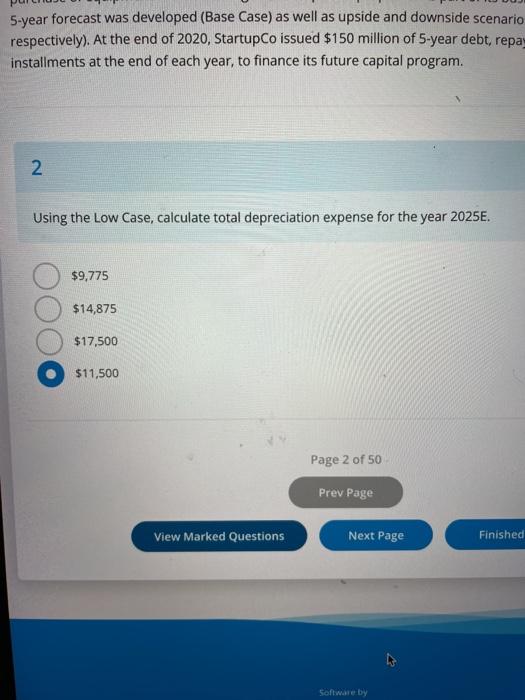
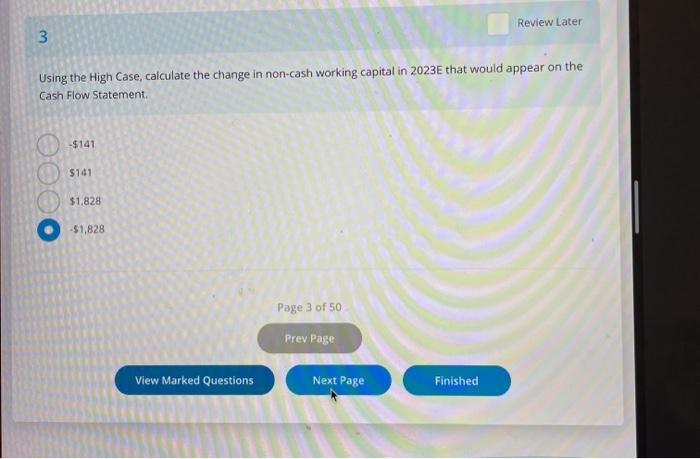
Based on the information in the table, what is the share price when the enterprise value to sales (EV/Sales) multiple of a comparable company is 2.4x? Income Statement Millions Sales $3,000 EBITDA $2,200 EBIT $1,750 Net Income $1,100 Balance Sheet Millions Cash and Cash Equivalents $120 Short Term Interest Bearing Debt $210 Long Term Interest Bearing Debt $850 BV Equity $1,500 Shares Outstanding in Millions 100 Share Price $48.7 $29.4 $13.5 $62.6 ID te BIU a. Av X Vfx Asset Salvage Value (% of Capital Addition) F E G D A B C Corporate Finance Institute. All rights reserved. odel Inputs and Assumptions Figures in US$000's unless otherwise stated. Model Inputs and Assumptions General Assumptions Forecast Scenario Days Per Year 365 Capital Expenditure Assumptions Asset Salvage Value (% of Capital Abdition) Asset Useful Lille 15% 10 Years 35 36 37 38 39 40 41 42 A Cover Page Control Panel Ready Financial Model Scenarios + C D E F G Corporate Finance Institute. All rights reserved. Istorical and Forecast Financial Information Figures in US$000's unless otherwise stated. H Total Liabilities 2020 $155,000 2021E $0 2022E $0 2023E $0 2024E 50 2025E $0 Shareholders' Equity Share Capital Retained Earnings Total Shareholders' Equity Total Liabilities and Shareholders' Equity $125,000 $10.500 $135,500 $290, 500 $0 50 $0 $0 $0 $0 $0 $0 $0 SO $10,500 $8.500 $0 $19,000 $0 50 $0 50 $0 Cash Flow Statement Operating Activities Net Income Adjustments For Depreciation Expense Changes in Non-Cash Working Capital Cash Generated From Operating Activities Investing Activities Additions to Property Plant & Equipment Cash (Used For) Investing Activities Financing Activities Issuance (Repayment) of Debt Issuance (Buy-back) of Equity Cash (Used For) Generated From Financing Activities Cash (Used) Generated in the Period Cash & Cash Equivalents, Beginning of Period Cash & Cash Equivalents, End of Period ($100.000) ($100,000) 8 50 $0 50 $0 $150,000 $125,000 $275,000 $0 $0 $0 50 50 $0 $0 $0 $0 $0 $194,000 $0 5194,000 $0 $0 $0 $0 50 Excel File Edit View Insert Format Tools AutoSave OF ABSU- Insert Draw Page Layout Formulas Data Arial v 11 A A BIU A Data Window Help CFL-_FMVA_Final_Asses Review View Tell me JU ab Wrap Text Gener Merge & Center $ D E H porate Finance Institute. Al rights reserved. cast Scenarios gures in US$600's unless otherwise stated. 2021E 2022E 2023E 2024E 2025E Live Case Income Statement Assumptions Annual Sales Growth Cost of Sales (% of Sales) SC&A Expense (% of Sales Interest Rate Effective Tax Rate Balance Sheet Assumptions Accounts Receivable (Days) Accounts Payable (Days) Capital Expenditures Equity issued (Repaid Scenario Inputs Base Case Income Statement Assumptions Annual Sales Growth (3) Cost of Sale % of Sales SGSA Expense of Sales 6,04 6.0% 40.0% 100% 6.0% 40.0N 10.0% 6.0% 40.0% 10.0% 6.0% 40.0% 100% 10.05 Interest Rate Effective Tax Rate 5.0% 25.0% 50% 25.0% 50% 25.0% 5.0% 25.0% 50% 25.05 Balance Sheet Assumptions Accounts Receivable (Days) Accounts Payable (Days Capital Expenditures Equity issued Repaid 30 25 $20.00 30 25 $20,000 59 301 25 $20.000 $0 30 25 $20.000 50 30 25 $20,000 $0 Low Case Cover Page Ready Control Panel Financial Model Scenarios Al Figures in US3000's unless onene sale 2021E 2022E 2023E 2024E 2025E Income Statement Assumptions Annual Sales Growth Cost of Sales (% of Sales) SGBA Expense % of Sales) 3.0% 450% 15.0% 3.0% 45.0% 15.0% 3.0% 45.0% 15.0% 30% 450% 15.0% 3.0% 45.0% 15.0% Interest Rato Effective Tax Rate 5.0% 25.0% 5.0% 25.0% 5.0% 25.0% 50% 25.0% 5.0% 25.0% 50 20 $15.000 $0 20 $15.000 $0 50 20 $15,000 $0 50 20 $15.000 $ 50 20 $15,000 $0 Balance Sheet Assumptions Accounts Receivable (Days) Accounts Payable (Days) Capital Expenditures Equity Issued (Repaid High Case Income Statement Assumptions Annual Sales Growth Cost of Sales (% of Sales) SGBA Expenso (% of Sales) 8.0% 30.0% 80% 8.0% 30.0% 8.0% 8.0% 30.0% 8.0% 8.0% 30.0% 8.0% 8.0% 30.0% 8.0% 5.0% Interest Rate Elective Tax Rate 5.0% 25.0% 5.0% 25.0% 5.0% 25.0% 5.0% 25.0% 25.0% Balance Sheet Assumptions Accounts Receivable (Days Accounts Payable (Days) Capital Expenditures Equity Issued (Repaid) 20 30 $30,000 $0 20 30 $30,000 $0 20 30 $30,000 $0 20 30 $30,000 $0 20 30 $30.000 $0 Cover Page Control Panel Financial Model Scenarios Ready 1 Using the Base Case, calculate net earnings for 2021E. $5,250 $6,600 $7,163 $7,725 5-year forecast was developed (Base Case) as well as upside and downside scenario respectively). At the end of 2020, StartupCo issued $150 million of 5-year debt repa installments at the end of each year, to finance its future capital program. 2 Using the Low Case, calculate total depreciation expense for the year 2025E. $9,775 $14,875 $17.500 $11,500 Page 2 of 50 Prev Page View Marked Questions Next Page Finished Software Dy Review Later 3 Using the High Case, calculate the change in non-cash working capital in 2023E that would appear on the Cash Flow Statement $141 $141 $1,828 -51,828 Page 3 of 50 Prev Page View Marked Questions Next Page Finished Download Case Study A, take all provided assumptions as given to complete the financial model and answer the following 7 questions. StartupCo commenced operations at the beginning of 2020, $125 million of equity was raised to fund the purchase of equipment as well as for general corporate purposes. As part of its business planning process, a 5-year forecast was developed (Base Case) as well as upside and downside scenarios (High and Low Cases, respectively). At the end of 2020, StartupCo issued $150 million of 5-year debt repayable in equal annual installments at the end of each year, to finance its future capital program
Step by Step Solution
There are 3 Steps involved in it

Get step-by-step solutions from verified subject matter experts