

Question: do any one By transforming the variables, we can estimate a linear multiple regression model and use the results as a nonlinear model. Inference procedures
do any one
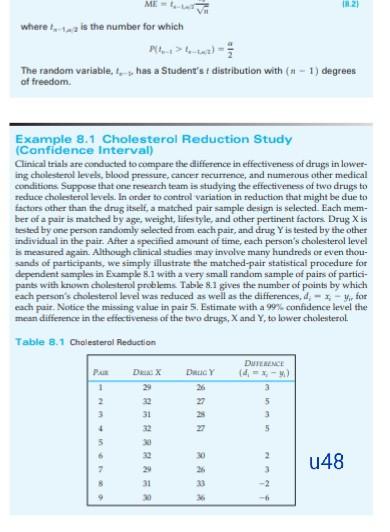
By transforming the variables, we can estimate a linear multiple regression model and use the results as a nonlinear model. Inference procedures for transformed quadratic mod- els are the same as those that we have previously developed for linear models. In this way we avoid confusion that would result if different statistical procedures were used for linear versus quadratic models. The coefficients must be combined for interpretation. Thus, if we have a quadratic model, then the effect of a variable, X, is indicated by the coefficients of both the linear and the quadratic terms. We can also perform a simple hypothesis best to de termine if a quadratic model is an improvement over a linear model The 2,0 X variable is merely an additional variable whose coefficient can be tested-HB-0-using the conditional Student's for statistic. If a quadratic model fits the data better than a linear model, then the coefficient of the quadratic variable-2-x-will be significantly differ- ent from 0. The same approach applies if we have variables such as Zx - X. - - xx 12.7 Taman Nenas Models u18 Example 12.11 Production Costs (Quadratic Model Estimation) Arnold Sorenson, production manager of New Frontiers Instruments, Inc. was inter- ested in estimating the mathematical relationship between the number of electronic assemblies produced during an 8-hour shift and the average cost per assembly. This function would then be used to estimate cost for various production order bids and to determine the production level that would minimize average cost. Data are found in the data file Production Cost ME- where te tas is the number for which The random variable, has a Student's t distribution with (1 - 1) degrees of freedom Example 8.1 Cholesterol Reduction Study (Confidence Interval) Clinical trials are conducted to compare the difference in effectiveness of drugs in lower- ing cholesterol levels, blood pressure, cancer recurrence, and numerous other medical conditions Suppose that one research team is studying the effectiveness of two drugs to reduce cholesterol levels. In order to control variation in reduction that might be due to factors other than the dragitselt, a matched pair sample design is selected. Each mem- ber of a pair is matched by age, weight, lifestyle, and other pertinent factors Drug X is tested by one person randomly selected from each pair, and drug Yis tested by the other individual in the pair. After a specified amount of time, each person's cholesterol level is measured again. Although clinical studies may involve many hundreds or even thou- sands of participants, we simply illustrate the matched-pair statistical procedure for dependent samples in Example 8.1 with a very small random sample of pairs of partici- pants with known cholesterol problems Table 8.1 gives the number of points by which each person's cholesterol level was reduced as well as the differences, di for each pair . Notice the missing value in pair 5. Estimate with a 99% confidence level the mean difference in the effectiveness of the two drugs, X and Y to lower cholesterol Table 8.1 Cholesterol Reduction DERENCE DX DucY 4,- 1 26 2 2 27 3 31 3 4 5 5 30 2 u48 3 - 2 3 5 22 0 RAR 31 30Step by Step Solution
There are 3 Steps involved in it
1 Expert Approved Answer
Step: 1 Unlock

Question Has Been Solved by an Expert!
Get step-by-step solutions from verified subject matter experts
Step: 2 Unlock
Step: 3 Unlock