

Question: *(DO NOT COPY PASTE PREVIOUS ANSWERED QUESTIONS PLEASE, NEED NEW ANSWERS)* Depending on the given Income Statement for the three years period of 2021, 2020,
*(DO NOT COPY PASTE PREVIOUS ANSWERED QUESTIONS PLEASE, NEED NEW ANSWERS)*
Depending on the given Income Statement for the three years period of 2021, 2020, 2019 a company, Analyze its performance and changes during those three years including reasons (Common-Size Income Statement Analysis)
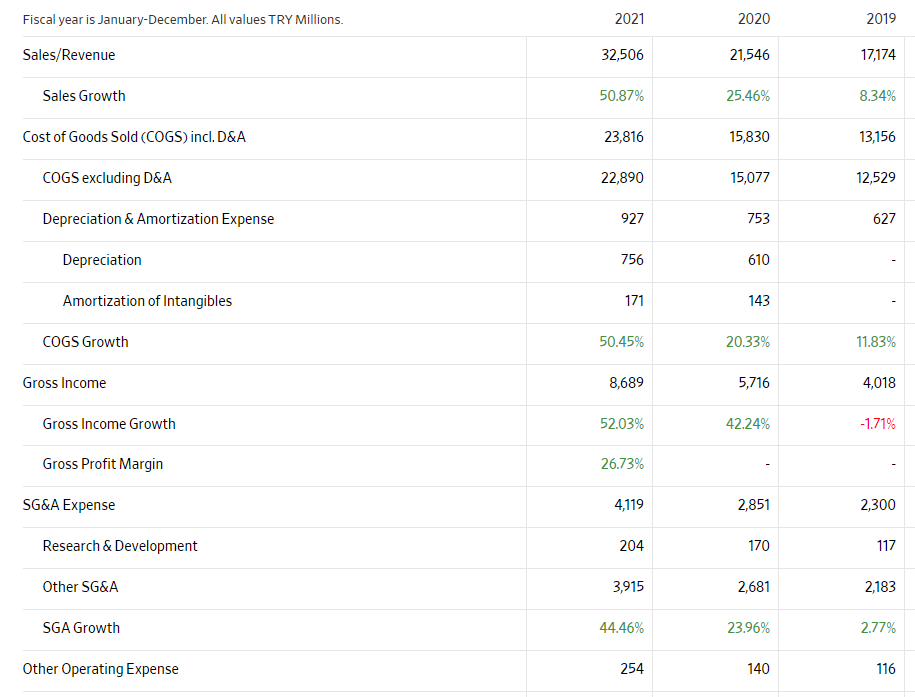
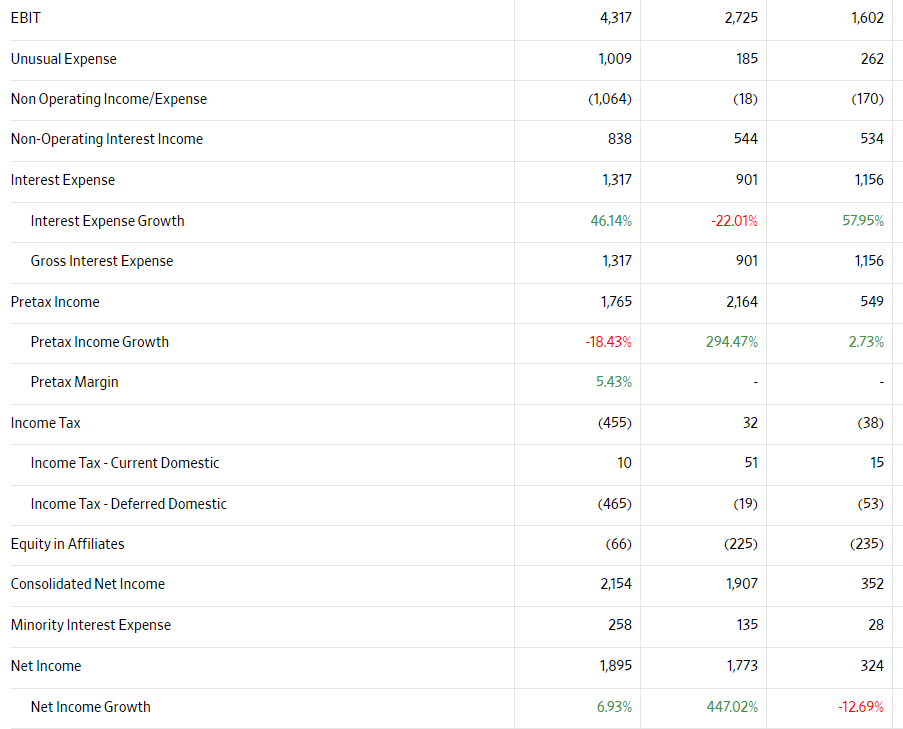
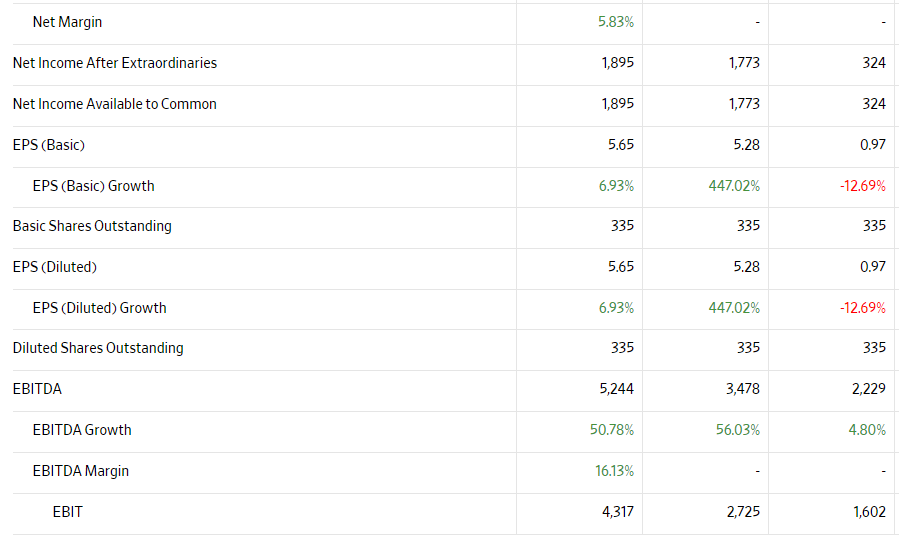
Fiscal year is January-December. All values TRY Millions. Sales/Revenue Sales Growth Cost of Goods Sold (COGS) incl. D&A COGS excluding D&A Depreciation & Amortization Expense Depreciation Amortization of Intangibles COGS Growth Gross Income Gross Income Growth Gross Profit Margin Research & Development Other SG&A SGA Growth Other Operating Expense SG&A Expense 2021 32,506 50.87% 23,816 22,890 927 756 171 50.45% 8,689 52.03% 26.73% 4,119 204 3,915 44.46% 254 2020 21,546 25.46% 15,830 15,077 753 610 143 20.33% 5,716 42.24% 2,851 170 2,681 23.96% 140 2019 17,174 8.34% 13,156 12,529 627 11.83% 4,018 -1.71% 2,300 117 2,183 2,77% 116 EBIT Unusual Expense Non Operating Income/Expense Non-Operating Interest Income Interest Expense Interest Expense Growth Gross Interest Expense Pretax Income Growth Pretax Margin Income Tax - Current Domestic Income Tax-Deferred Domestic Equity in Affiliates Consolidated Net Income Minority Interest Expense Net Income Net Income Growth Pretax Income Income Tax 4,317 1,009 (1,064) 838 1,317 46.14% 1,317 1,765 -18.43% 5.43% (455) 10 (465) (66) 2,154 258 1,895 6.93% 2,725 185 (18) 544 901 -22.01% 901 2,164 294.47% 32 51 (19) (225) 1,907 135 1,773 447.02% 1,602 262 (170) 534 1,156 57.95% 1,156 549 2.73% (38) 15 (53) (235) 352 28 324 -12.69% Net Margin Net Income After Extraordinaries Net Income Available to Common EPS (Basic) EPS (Basic) Growth Basic Shares Outstanding EPS (Diluted) EPS (Diluted) Growth Diluted Shares Outstanding EBITDA EBITDA Growth EBITDA Margin EBIT 5.83% 1,895 1,895 5.65 6.93% 335 5.65 6.93% 335 5,244 50.78% 16.13% 4,317 1,773 1,773 5.28 447.02% 335 5.28 447.02% 335 3,478 56.03% 2,725 324 324 0.97 -12.69% 335 0.97 -12.69% 335 2,229 4.80% 1,602 Fiscal year is January-December. All values TRY Millions. Sales/Revenue Sales Growth Cost of Goods Sold (COGS) incl. D&A COGS excluding D&A Depreciation & Amortization Expense Depreciation Amortization of Intangibles COGS Growth Gross Income Gross Income Growth Gross Profit Margin Research & Development Other SG&A SGA Growth Other Operating Expense SG&A Expense 2021 32,506 50.87% 23,816 22,890 927 756 171 50.45% 8,689 52.03% 26.73% 4,119 204 3,915 44.46% 254 2020 21,546 25.46% 15,830 15,077 753 610 143 20.33% 5,716 42.24% 2,851 170 2,681 23.96% 140 2019 17,174 8.34% 13,156 12,529 627 11.83% 4,018 -1.71% 2,300 117 2,183 2,77% 116 EBIT Unusual Expense Non Operating Income/Expense Non-Operating Interest Income Interest Expense Interest Expense Growth Gross Interest Expense Pretax Income Growth Pretax Margin Income Tax - Current Domestic Income Tax-Deferred Domestic Equity in Affiliates Consolidated Net Income Minority Interest Expense Net Income Net Income Growth Pretax Income Income Tax 4,317 1,009 (1,064) 838 1,317 46.14% 1,317 1,765 -18.43% 5.43% (455) 10 (465) (66) 2,154 258 1,895 6.93% 2,725 185 (18) 544 901 -22.01% 901 2,164 294.47% 32 51 (19) (225) 1,907 135 1,773 447.02% 1,602 262 (170) 534 1,156 57.95% 1,156 549 2.73% (38) 15 (53) (235) 352 28 324 -12.69% Net Margin Net Income After Extraordinaries Net Income Available to Common EPS (Basic) EPS (Basic) Growth Basic Shares Outstanding EPS (Diluted) EPS (Diluted) Growth Diluted Shares Outstanding EBITDA EBITDA Growth EBITDA Margin EBIT 5.83% 1,895 1,895 5.65 6.93% 335 5.65 6.93% 335 5,244 50.78% 16.13% 4,317 1,773 1,773 5.28 447.02% 335 5.28 447.02% 335 3,478 56.03% 2,725 324 324 0.97 -12.69% 335 0.97 -12.69% 335 2,229 4.80% 1,602
Step by Step Solution
There are 3 Steps involved in it

Get step-by-step solutions from verified subject matter experts