

Question: do not use excel Q2 Hospital system also facing a few pressing problem such as clinical variation, medical errors, delays in patient discharge and admission.
do not use excel
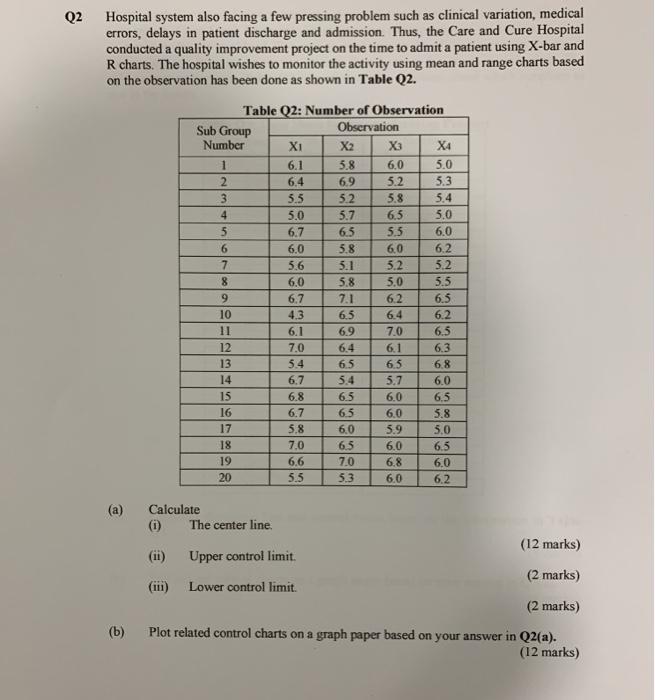
Q2 Hospital system also facing a few pressing problem such as clinical variation, medical errors, delays in patient discharge and admission. Thus, the Care and Cure Hospital conducted a quality improvement project on the time to admit a patient using X-bar and R charts. The hospital wishes to monitor the activity using mean and range charts based on the observation has been done as shown in Table Q2. 6,0 Table Q2: Number of Observation Sub Group Observation Number XI X2 X3 X4 1 6.1 5.8 5.0 2 6,4 6.9 5.2 5.3 3 5.5 5.2 5.8 5.4 5.0 5.7 6,5 5.0 6.7 6.5 5.5 6.0 6 6,0 5.8 6,0 6.2 7 5.6 5.1 52 3.2 8 6.0 5.8 5.0 5.5 9 6,7 7.1 62 6.5 10 4.3 6.5 6.4 6.2 11 6.1 6.9 7.0 6.5 12 7.0 6.4 6.1 6.3 13 5.4 6.5 65 6.8 14 6.7 5.4 5.7 6.0 15 6.8 6.5 6.0 6.5 16 6.7 6.5 6.0 5.8 17 5.8 6.0 5.9 5.0 18 7.0 65 6.0 6.5 19 6.6 7.0 6,8 6.0 20 5.5 5.3 6.0 6.2 5 (a) (11 Calculate 0 The center line. (12 marks) Upper controllimit (2 marks) (iii) Lower control limit. (2 marks) Plot related control charts on a graph paper based on your answer in Q2(a). (12 marks) (b)
Step by Step Solution
There are 3 Steps involved in it
1 Expert Approved Answer
Step: 1 Unlock

Question Has Been Solved by an Expert!
Get step-by-step solutions from verified subject matter experts
Step: 2 Unlock
Step: 3 Unlock