

Question: this is subject IT copmputer total quality managment staics Q2 Hospital system also facing a few pressing problem such as clinical variation, medical errors, delays
 this is subject IT copmputer
total quality managment staics
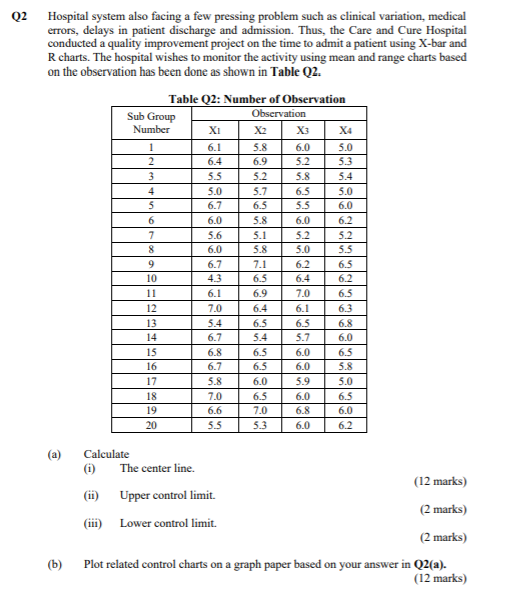
Q2 Hospital system also facing a few pressing problem such as clinical variation, medical errors, delays in patient discharge and admission. Thus, the Care and Cure Hospital conducted a quality improvement project on the time to admit a patient using X-bar and Rcharts. The hospital wishes to monitor the activity using mean and range charts based on the observation has been done as shown in Table Q2. Table Q2: Number of Observation Sub Group Number X4 5.0 5.3 5.4 XI 6.1 6.4 5.5 5.0 6.7 6.0 5.6 6.0 6.7 Observation X2 X3 5.8 6.0 6.9 5.2 5.2 5.8 5.7 6.5 6.5 5.5 5.8 6.0 5.1 5.2 5.8 5.0 7.1 6.2 6.5 6.4 6.9 7.0 6.4 6.1 6.5 6.5 5.4 5.7 6.5 6.0 1 2 3 4 5 6 7 8 9 10 11 12 13 14 15 16 17 18 19 20 5.0 6.0 6.2 5.2 5.5 6.5 6.2 6.5 6.3 6.8 6.0 6.5 43 6.1 7.0 5.4 6.7 6.8 6.7 5.8 7.0 6.6 5.5 6.5 6.0 5.8 5.0 6.5 6.0 6.5 7.0 5.3 5.9 6.0 6.8 6.0 6.0 6.2 (a) Calculate (1) The center line. (12 marks) (11) Upper control limit. (2 marks) (iii) Lower control limit. (2 marks) Plot related control charts on a graph paper based on your answer in Q2(a). (12 marks) (b)Step by Step Solution
There are 3 Steps involved in it
1 Expert Approved Answer
Step: 1 Unlock

Question Has Been Solved by an Expert!
Get step-by-step solutions from verified subject matter experts
Step: 2 Unlock
Step: 3 Unlock