

Question: Do province fixed effects explain any variation in the dependent variable? [1 mark] Interpret the two coefficients in model 3. [3 marks] Interpret the coefficient
- Do province fixed effects explain any variation in the dependent variable? [1 mark]
- Interpret the two coefficients in model 3. [3 marks]
- Interpret the coefficient on the variable East Coast X Student-Teacher Ratio in model 4. [3 marks]
- What is the total effect of one additional unit increase in Student-Teacher Ratio for schools in the East Coast, based on the results shown in the table? [2 marks]
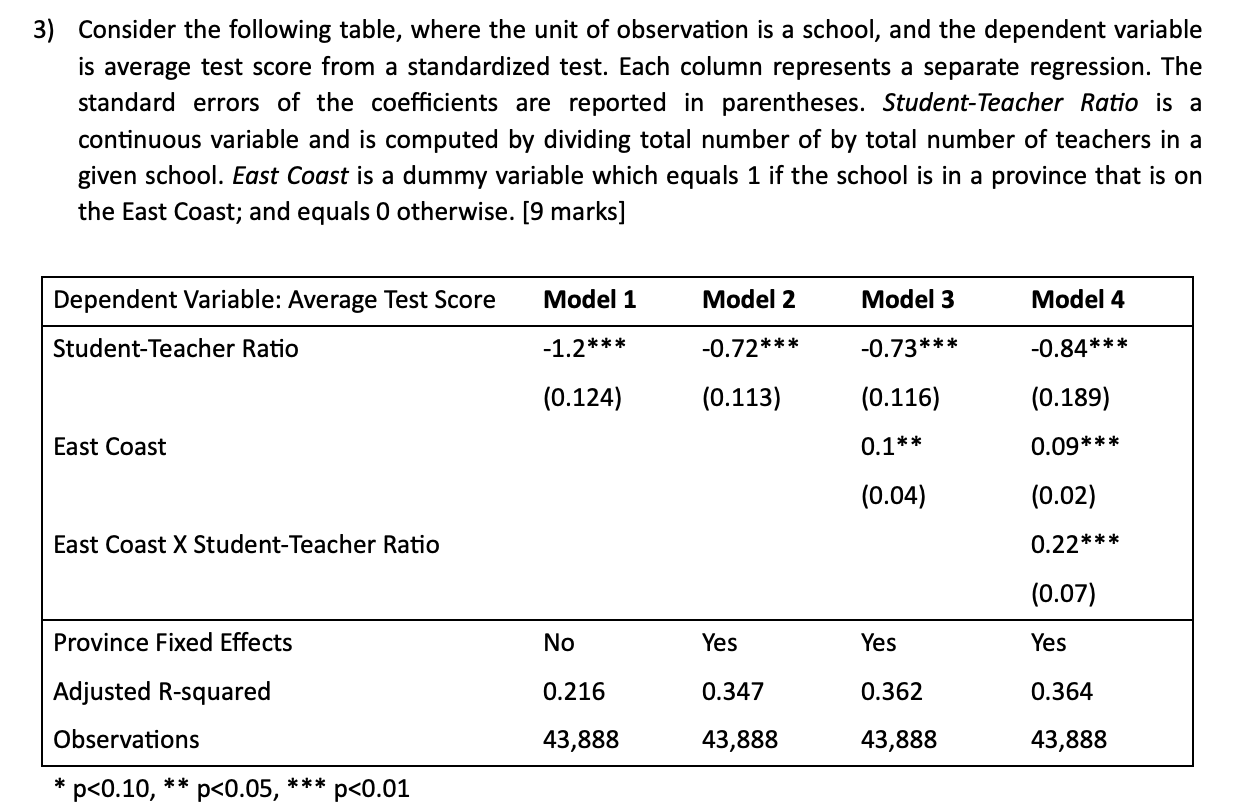
3) Consider the following table, where the unit of observation is a school, and the dependent variable is average test score from a standardized test. Each column represents a separate regression. The standard errors of the coefficients are reported in parentheses. Student-Teacher Ratio is a continuous variable and is computed by dividing total number of by total number of teachers in a given school. East Coast is a dummy variable which equals 1 if the school is in a province that is on the East Coast; and equals 0 otherwise. [9 marks] Dependent Variable: Average Test Score Model 1 Model 2 Model 3 Model 4 Student-Teacher Ratio -1.2*** -0.72*** -0.73*** -0.84*** (0.124) (0.113) (0.116) (0.189) East Coast 0.1** 0.09*** (0.04) (0.02) East Coast X Student-Teacher Ratio 0.22*** (0.07) Province Fixed Effects No Yes Yes Yes Adjusted R-squared 0.216 0.347 0.362 0.364 Observations 43,888 43,888 43,888 43,888 * p
Step by Step Solution
There are 3 Steps involved in it

Get step-by-step solutions from verified subject matter experts