

Question: I need help to understand the model 1. Can you show your full work for Model 1 so I can know how to do with
I need help to understand the model 1. Can you show your full work for Model 1 so I can know how to do with Model 2. Thank you so much!
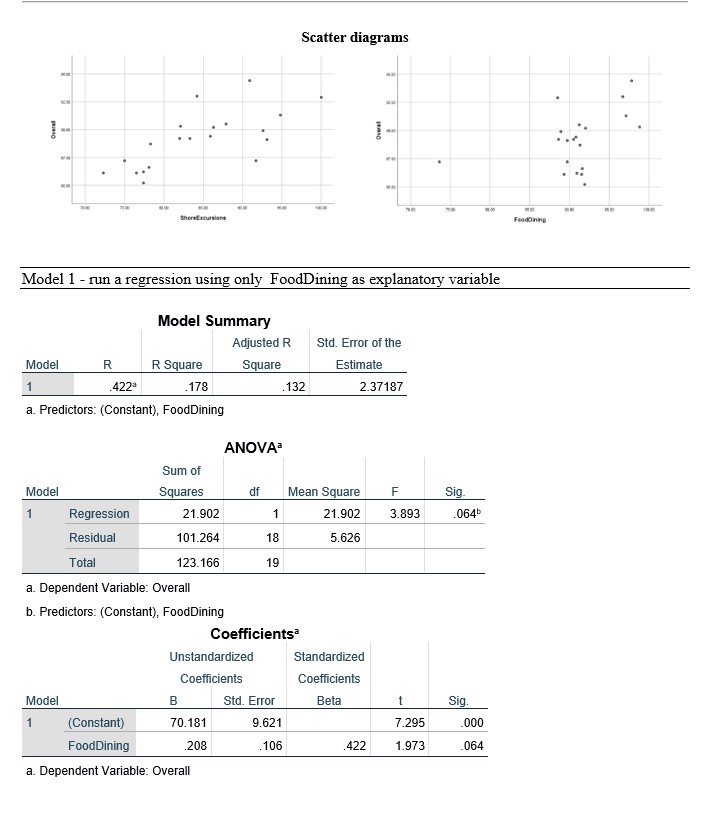
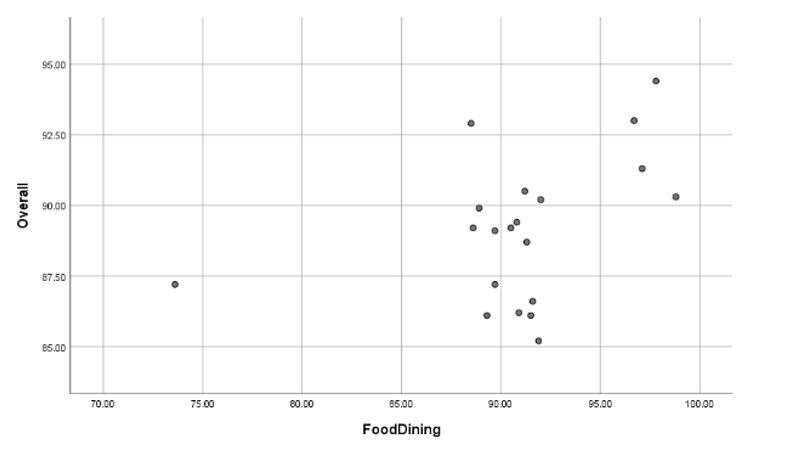
Scatter diagrams Overall Overal Model 1 - run a regression using only FoodDining as explanatory variable Model Summary Adjusted R Std. Error of the Model R R Square Square Estimate 422 178 132 2.37187 a. Predictors: (Constant), FoodDining ANOVA Sum of Model Squares df Mean Square F sig. Regression 21.902 1 21.902 3.893 064b Residual 101.264 18 5.626 Total 123.166 19 a. Dependent Variable: Overall b. Predictors: (Constant), FoodDining Coefficients Unstandardized Standardized Coefficients Coefficients Model B Std. Error Beta Sig. 1 (Constant) 70.181 9.621 7.295 000 FoodDining 208 106 122 1.973 064 a. Dependent Variable:The well-known Gold list for cruise ships is based on respondents who rate the cruise according to Shore Excursions and Food/dining. As a statistician you are asked to specifically determine how much these two variables (expressed in percentage) explain the overall rating of the cruise (also in percentage terms) a. (1pt) Refer to scatter diagrams and comment on the relationship of each explanatory variable to the overall cruise score. Answer: Model 1 - run a regression using FoodDining as explanatory variable 1. (1pt) Comment on the goodness of fit of Model 1. Answer: 2. (1pt) Report the statistical significance of the model Answer: 3. (1pt) Write the regression equation for Model 1. Answer: 4. (1pt) Interpret the intercept. Answer 5. (1pt) Interpret the slope coefficient. Answer: 6. (2pt) Report the statistical significance of all coefficients. Answer: Model 2 - include the variable ShoreExcursions 1. (1pt) Comment on the goodness of fit for Model 2. Answer: 2. (1pt) Report the statistical significance of the model. Answer: 3. (1pt) Write down the estimated regression equation for Model 2. Answer: 4. (2pt) Interpret the intercept for the model. Answer: 5. (1pt) Interpret the slope coefficient. Answer: 6. (1pt) Report the statistical significance of all coefficients. Answer:\f
Step by Step Solution
There are 3 Steps involved in it

Get step-by-step solutions from verified subject matter experts