Question: Do question 6 base on question 5 It appears that the actual weekly pie profits of Simon Pie Company are less than projected. Mr. Simon

Do question 6 base on question 5 Do question 6 base on question 5 It appears that
It appears that the actual weekly pie profits of Simon Pie Company are less than projected. Mr. Simon suspects the processing cost formula to be misleading. In order to validate this part of the profit model, he collects data from his company on the different processing costs for various levels of pie production. See the table below. 8 10 12 14 Number of Pies 6 (000's) 16 18 20 22 10.2 15.5 23.6 31.4 40.1 44.3 54.1 58.9 Processing cost 9.1 (Actual) a. Draw a graph representing the actual processing cost and the projected one with respect to the number of pies demanded and sold. b. Add a linear trend as a fit for the actual processing cost. The new graph obtained should display the processing cost equation. c. With the equation of processing cost generated, compute the new values of the financial results. Note: Create Sheet_95 containing all calculations and graphs. Question 6: a. Do a sensitivity analysis of question 5 for pie prices between $ 8.5 and $ 10. b. Represent the financial results derived, with the pie prices on the horizontal axis. All calculations and graphs should appear on Sheet_26

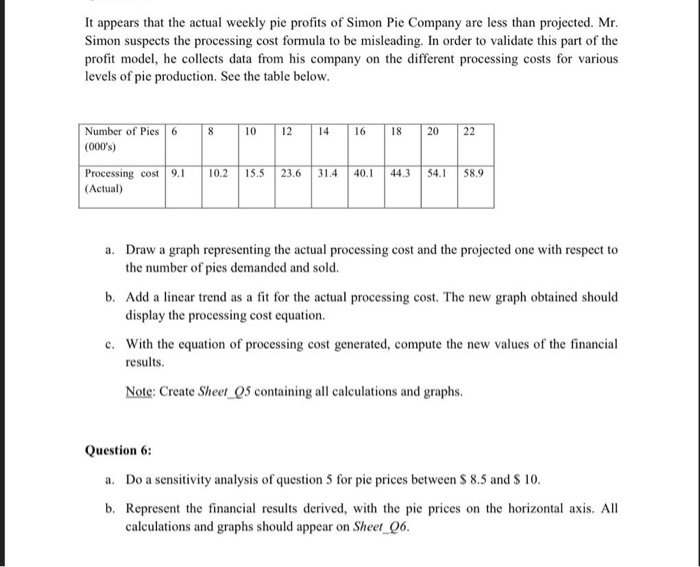
Step by Step Solution

There are 3 Steps involved in it

1 Expert Approved Answer
Step: 1 Unlock blur-text-image
Question Has Been Solved by an Expert!

Get step-by-step solutions from verified subject matter experts

Step: 2 Unlock
Step: 3 Unlock

Students Have Also Explored These Related General Management Questions!