

Question: Do the following: a) Construct an empirical CDF for each asset. Please use the midpoint plotting positions. b) Construct a Weibull Probability Plot for the
Do the following: a) Construct an empirical CDF for each asset. Please use the midpoint plotting positions. b) Construct a Weibull Probability Plot for the asset using Excel or MATLAB and estimate Weibull parameters ( ). Comment on what you expect to see if a Weibull is a good fit for this data.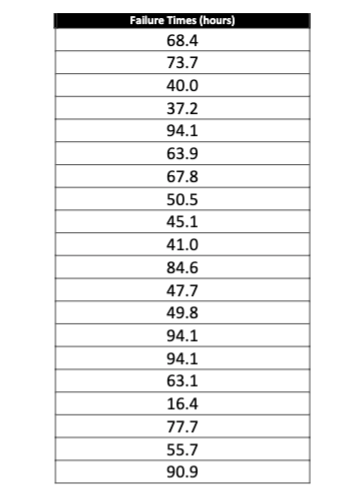
\begin{tabular}{|c|} \hline Fallure Times (hours) \\ \hline 68.4 \\ \hline 73.7 \\ \hline 40.0 \\ \hline 37.2 \\ \hline 94.1 \\ \hline 63.9 \\ \hline 67.8 \\ \hline 50.5 \\ \hline 45.1 \\ \hline 41.0 \\ \hline 84.6 \\ \hline 47.7 \\ \hline 49.8 \\ \hline 94.1 \\ \hline 94.1 \\ \hline 63.1 \\ \hline 16.4 \\ \hline 77.7 \\ \hline 55.7 \\ \hline 90.9 \\ \hline \end{tabular}
Step by Step Solution
There are 3 Steps involved in it

Get step-by-step solutions from verified subject matter experts