

Question: Do via Matlab, will upvote thank you 2. Solve the first problem 3.23 (yes, there's a typo in the book regarding problem numbering). This problem
Do via Matlab, will upvote thank you
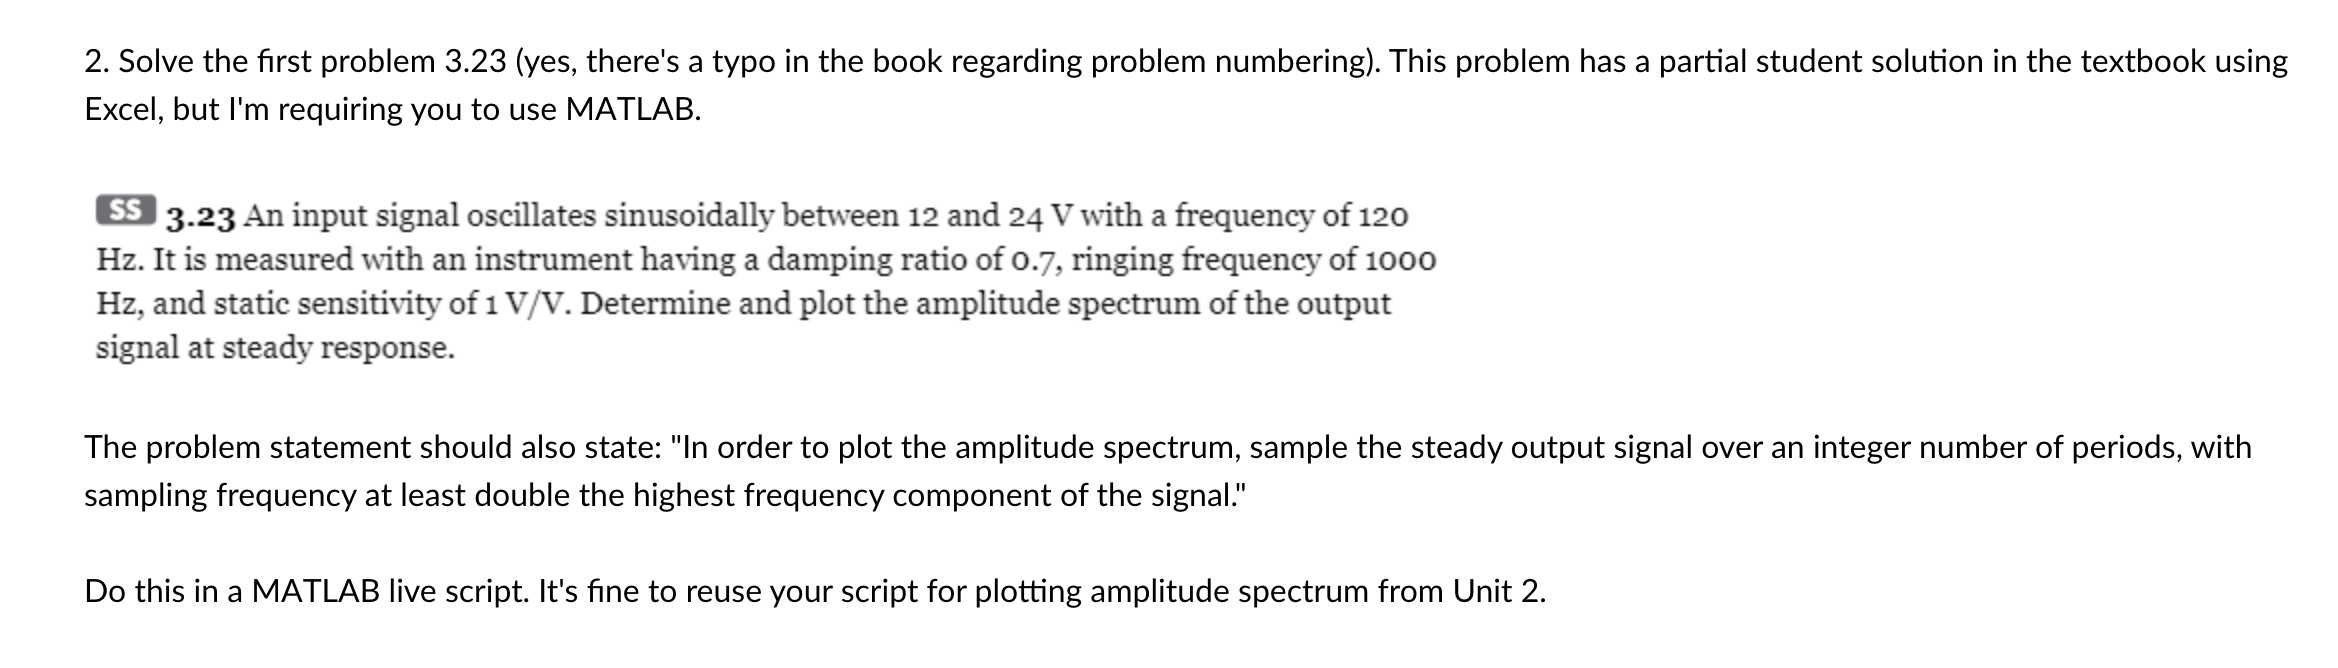
2. Solve the first problem 3.23 (yes, there's a typo in the book regarding problem numbering). This problem has a partial student solution in the textbook using Excel, but I'm requiring you to use MATLAB. SS 3.23 An input signal oscillates sinusoidally between 12 and 24 V with a frequency of 120 Hz. It is measured with an instrument having a damping ratio of 0.7, ringing frequency of 1000 Hz, and static sensitivity of 1V/V. Determine and plot the amplitude spectrum of the output signal at steady response. The problem statement should also state: "In order to plot the amplitude spectrum, sample the steady output signal over an integer number of periods, with sampling frequency at least double the highest frequency component of the signal." Do this in a MATLAB live script. It's fine to reuse your script for plotting amplitude spectrum from Unit 2. 2. Solve the first problem 3.23 (yes, there's a typo in the book regarding problem numbering). This problem has a partial student solution in the textbook using Excel, but I'm requiring you to use MATLAB. SS 3.23 An input signal oscillates sinusoidally between 12 and 24 V with a frequency of 120 Hz. It is measured with an instrument having a damping ratio of 0.7, ringing frequency of 1000 Hz, and static sensitivity of 1V/V. Determine and plot the amplitude spectrum of the output signal at steady response. The problem statement should also state: "In order to plot the amplitude spectrum, sample the steady output signal over an integer number of periods, with sampling frequency at least double the highest frequency component of the signal." Do this in a MATLAB live script. It's fine to reuse your script for plotting amplitude spectrum from Unit 2
Step by Step Solution
There are 3 Steps involved in it

Get step-by-step solutions from verified subject matter experts