

Question: Do you have the answar and solution to this home work? Question: The nine companies in the attached exhibit are drawn from the following industries:
Do you have the answar and solution to this home work?
Question: The nine companies in the attached exhibit are drawn from the following industries: Aerospace, Ai...
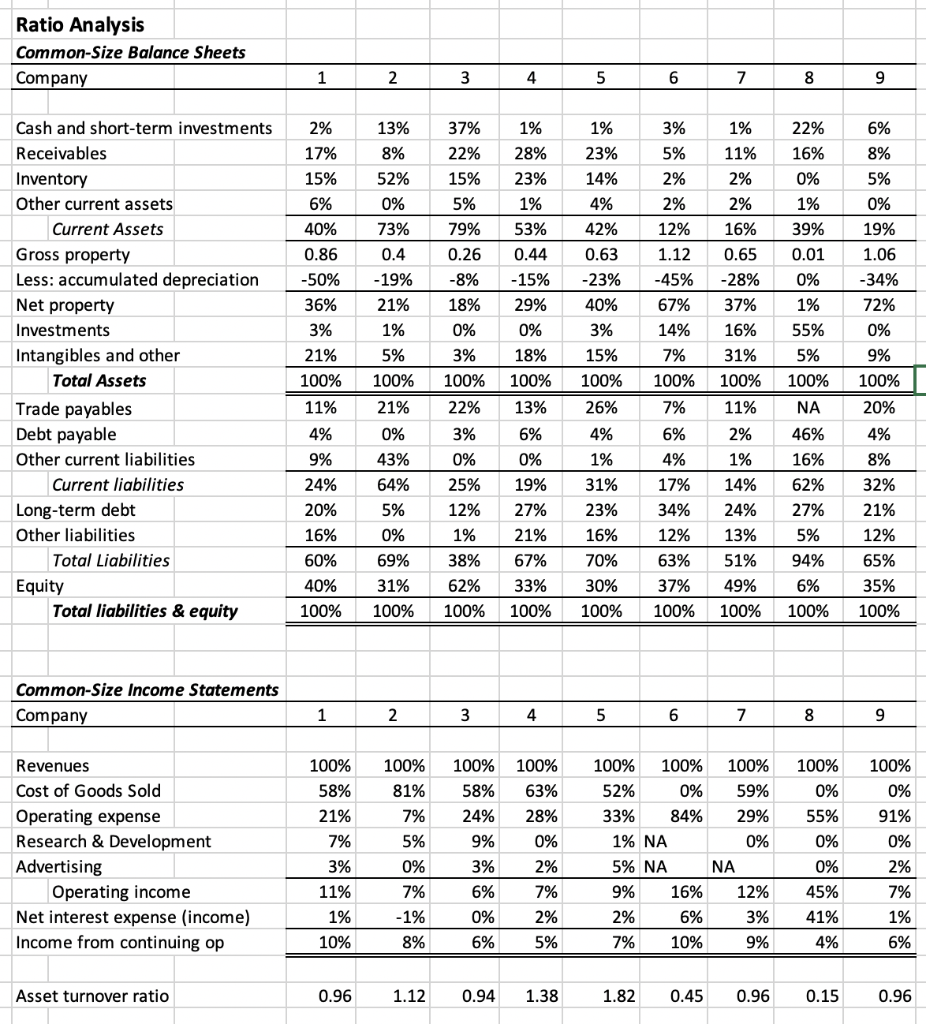
The nine companies in the attached exhibit are drawn from the following industries:
Aerospace, Airline, Chemicals & drugs, Computer software, Consumer foods, Department stores, Consumer finance, Newspaper publishing, and Electric utility
- Based on the common size statements and Total Asset Turnover ratio, match each company into its industry. (A higher total asset turnover over usually indicates that the company uses its assets more efficiently than a company with a lower turnover ratio.)
- BRIEFLY discuss the balance sheet and income statement characteristics that helped you to identify the industry to which each company belonged. For example, a relatively high percentage for inventory on the balance sheet could indicate the company is a retail company.
Show transcribed image textView comments (1)
Ratio Analysis Common-Size Balance Sheets Company 1 2 3 4 5 6 7 8 9 37% 22% 2% 17% 15% 6% 40% 0.86 -50% 36% 3% 21% 100% 13% 8% 52% 0% 73% 0.4 -19% 15% 5% 79% 0.26 -8% 18% 3% 5% 2% 2% 12% 1.12 -45% 22% 16% 0% 1% 39% 0.01 0% 21% Cash and short-term investments Receivables Inventory Other current assets Current Assets Gross property Less: accumulated depreciation Net property Investments Intangibles and other Total Assets Trade payables Debt payable Other current liabilities Current liabilities Long-term debt Other liabilities Total Liabilities Equity Total liabilities & equity 1% 11% 2% 2% 16% 0.65 -28% 37% 16% 31% 100% 11% 2% 67% 0% 1% 28% 23% 1% 53% 0.44 -15% 29% 0% 18% 100% 13% 6% 0% 19% 27% 21% 67% 33% 100% 1% 23% 14% 4% 42% 0.63 -23% 40% 3% 15% 100% 26% 4% 1% 31% 23% 16% 70% 30% 100% 1% 5% 100% 21% 0% 43% 64% 5% 0% 69% 31% 100% 3% 100% 22% 3% 0% 25% 12% 1% 38% 62% 100% 1% 11% 4% 9% 24% 20% 16% 60% 40% 100% 6% 8% 5% 0% 19% 1.06 -34% 72% 0% 9% 100% 20% 4% 8% 32% 21% 12% 65% 35% 100% 14% 7% 100% 7% 6% 4% 17% 34% 12% 63% 37% 100% 1% 55% 5% 100% NA 46% 16% 62% 27% 5% 94% 6% 100% 14% 24% 13% 51% 49% 100% Common-Size Income Statements Company 1 2 3 4 5 6 7 8 9 100% 0% 55% 0% Revenues Cost of Goods Sold Operating expense Research & Development Advertising Operating income Net interest expense (income) Income from continuing op 100% 58% 21% 7% 3% 11% 1% 10% 100% 81% 7% 5% 0% 7% -1% 8% 100% 58% 24% 9% 3% 6% 0% 6% 100% 63% 28% 0% 2% 7% 2% 5% 100% 100% 100% 52% 0% 59% 33% 84% 29% 1% NA 0% 5% NA NA 9% 16% 12% 2% 6% 3% 7% 10% 9% 100% 0% 91% 0% 2% 7% 1% 6% 0% 45% 41% 4% Asset turnover ratio 0.96 1.12 0.94 1.38 1.82 0.45 0.96 0.15 0.96
Step by Step Solution
There are 3 Steps involved in it

Get step-by-step solutions from verified subject matter experts