

Question: Do you see any potential outliers I the above scatterplot if so what do they represent? 450,000 400,000 350,000 O 300,000 O 250,000 O Y=
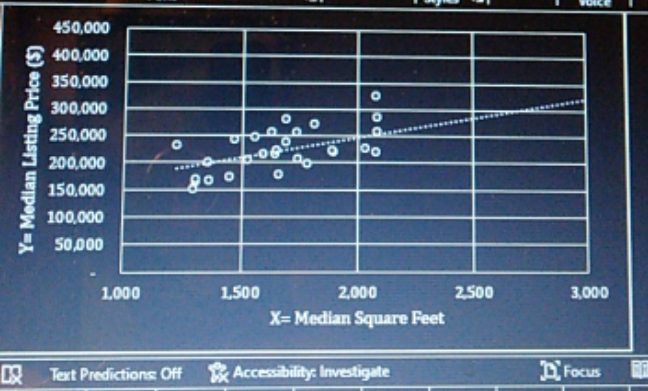
Do you see any potential outliers I the above scatterplot if so what do they represent?

450,000 400,000 350,000 O 300,000 O 250,000 O Y= Median Listing Price ($) 200,000 O 150,000 100,000 50,000 1.000 1,500 2,000 2500 3,000 X= Median Square Feet Text Predictions Off Accessibility: Investigate Focus
Step by Step Solution
There are 3 Steps involved in it
1 Expert Approved Answer
Step: 1 Unlock

Question Has Been Solved by an Expert!
Get step-by-step solutions from verified subject matter experts
Step: 2 Unlock
Step: 3 Unlock