

Question: Please help: Considering inflation, what changes would you make to the base-case numbers associated with your NPV analysis? How might those changes impact the expected
Please help:
Considering inflation, what changes would you make to the base-case numbers associated with your NPV analysis? How might those changes impact the expected cash flows (and NPV)?
Need to do all calculations first before we can figure this out
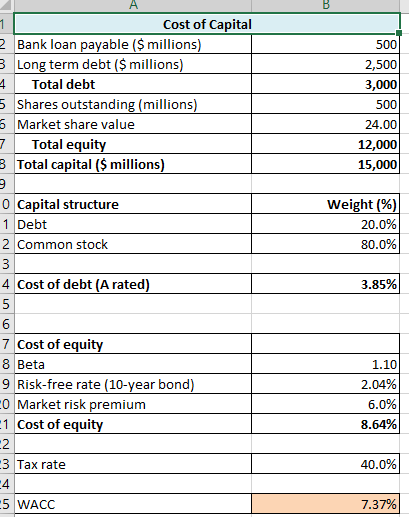
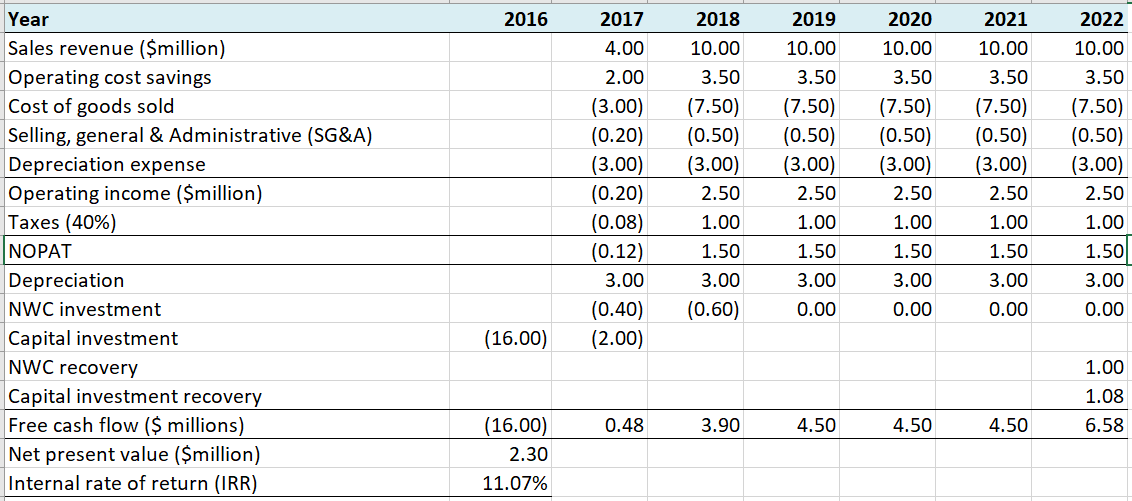
A 1 Cost of Capital 2 Bank loan payable ($ millions) 3 Long term debt ($ millions) 4 Total debt 5 shares outstanding (millions) 6 Market share value 7 Total equity 8 Total capital ($ millions) 500 2,500 3,000 500 24.00 12,000 15,000 Weight (%) 20.0% 80.0% 3.85% o Capital structure 1 Debt 2 Common stock 3 4 Cost of debt (A rated) 5 6 7 Cost of equity 8 Beta 9 Risk-free rate (10-year bond) CO Market risk premium -1 Cost of equity -2 -3 Tax rate 4 -5 WACC 1.10 2.04% 6.0% 8.64% 40.0% 7.37% 2016 2017 2018 2019 2022 Year Sales revenue ($million) Operating cost savings Cost of goods sold Selling, general & Administrative (SG&A) Depreciation expense Operating income ($million) Taxes (40%) NOPAT Depreciation NWC investment Capital investment NWC recovery Capital investment recovery Free cash flow ($ millions) Net present value ($million) Internal rate of return (IRR) 4.00 2.00 (3.00) (0.20) (3.00) (0.20) (0.08) (0.12) 3.00 (0.40) (2.00) 10.00 3.50 (7.50) (0.50) (3.00) 2.50 1.00 1.50 3.00 (0.60) 10.00 3.50 (7.50) (0.50) (3.00) 2.50 1.00 1.50 3.00 0.00 2020 10.00 3.50 (7.50) (0.50) (3.00) 2.50 1.00 1.50 3.00 0.00 2021 10.00 3.50 (7.50) (0.50) (3.00) 2.50 1.00 1.50 3.00 0.00 10.00 3.50 (7.50) (0.50) (3.00) 2.50 1.00 1.50 3.00 0.00 (16.00) 1.00 1.08 6.58 0.48 3.90 4.50 4.50 4.50 (16.00) 2.30 11.07% A 1 Cost of Capital 2 Bank loan payable ($ millions) 3 Long term debt ($ millions) 4 Total debt 5 shares outstanding (millions) 6 Market share value 7 Total equity 8 Total capital ($ millions) 500 2,500 3,000 500 24.00 12,000 15,000 Weight (%) 20.0% 80.0% 3.85% o Capital structure 1 Debt 2 Common stock 3 4 Cost of debt (A rated) 5 6 7 Cost of equity 8 Beta 9 Risk-free rate (10-year bond) CO Market risk premium -1 Cost of equity -2 -3 Tax rate 4 -5 WACC 1.10 2.04% 6.0% 8.64% 40.0% 7.37% 2016 2017 2018 2019 2022 Year Sales revenue ($million) Operating cost savings Cost of goods sold Selling, general & Administrative (SG&A) Depreciation expense Operating income ($million) Taxes (40%) NOPAT Depreciation NWC investment Capital investment NWC recovery Capital investment recovery Free cash flow ($ millions) Net present value ($million) Internal rate of return (IRR) 4.00 2.00 (3.00) (0.20) (3.00) (0.20) (0.08) (0.12) 3.00 (0.40) (2.00) 10.00 3.50 (7.50) (0.50) (3.00) 2.50 1.00 1.50 3.00 (0.60) 10.00 3.50 (7.50) (0.50) (3.00) 2.50 1.00 1.50 3.00 0.00 2020 10.00 3.50 (7.50) (0.50) (3.00) 2.50 1.00 1.50 3.00 0.00 2021 10.00 3.50 (7.50) (0.50) (3.00) 2.50 1.00 1.50 3.00 0.00 10.00 3.50 (7.50) (0.50) (3.00) 2.50 1.00 1.50 3.00 0.00 (16.00) 1.00 1.08 6.58 0.48 3.90 4.50 4.50 4.50 (16.00) 2.30 11.07%
Step by Step Solution
There are 3 Steps involved in it

Get step-by-step solutions from verified subject matter experts