

Question: does anyone know this? Figure 6 below illustrates the labour market equilibrium wage and employment of a hypothetical economy, represented by Point A. Figure 6
does anyone know this?
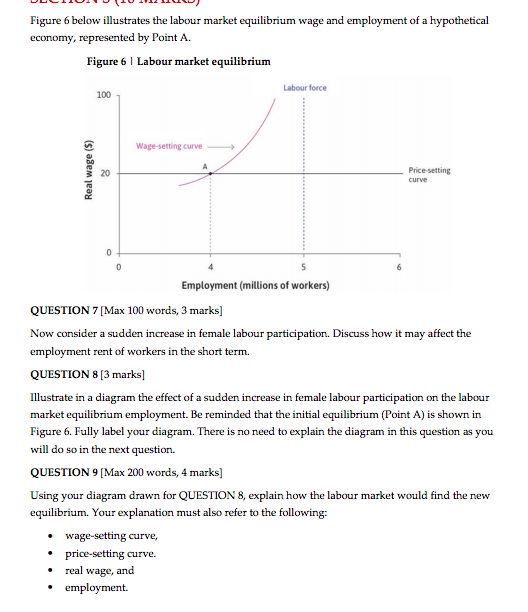
Figure 6 below illustrates the labour market equilibrium wage and employment of a hypothetical economy, represented by Point A. Figure 6 | Labour market equilibrium 100 Labour force Real wage ($) Wage setting curve 20 Price-setting curve 5 Employment (millions of workers) QUESTION 7 [Max 100 words, 3 marks] Now consider a sudden increase in female labour participation. Discuss how it may affect the employment rent of workers in the short term. QUESTION : [3 marks] Illustrate in a diagram the effect of a sudden increase in female labour participation on the labour market equilibrium employment. Be reminded that the initial equilibrium (Point A) is shown in Figure 6. Fully label your diagram. There is no need to explain the diagram in this question as you will do so in the next question. QUESTION 9 [ Max 200 words, 4 marks] Using your diagram drawn for QUESTION 8, explain how the labour market would find the new equilibrium. Your explanation must also refer to the following: wage-setting curve, price-setting curve. real wage, and employment
Step by Step Solution
There are 3 Steps involved in it

Get step-by-step solutions from verified subject matter experts