

Question: Does the data suggest that these two groups differ in the amount of income earned in after school jobs? Interpret the data Assignment: Two Sample
Does the data suggest that these two groups differ in the amount of income earned in after school jobs? Interpret the data
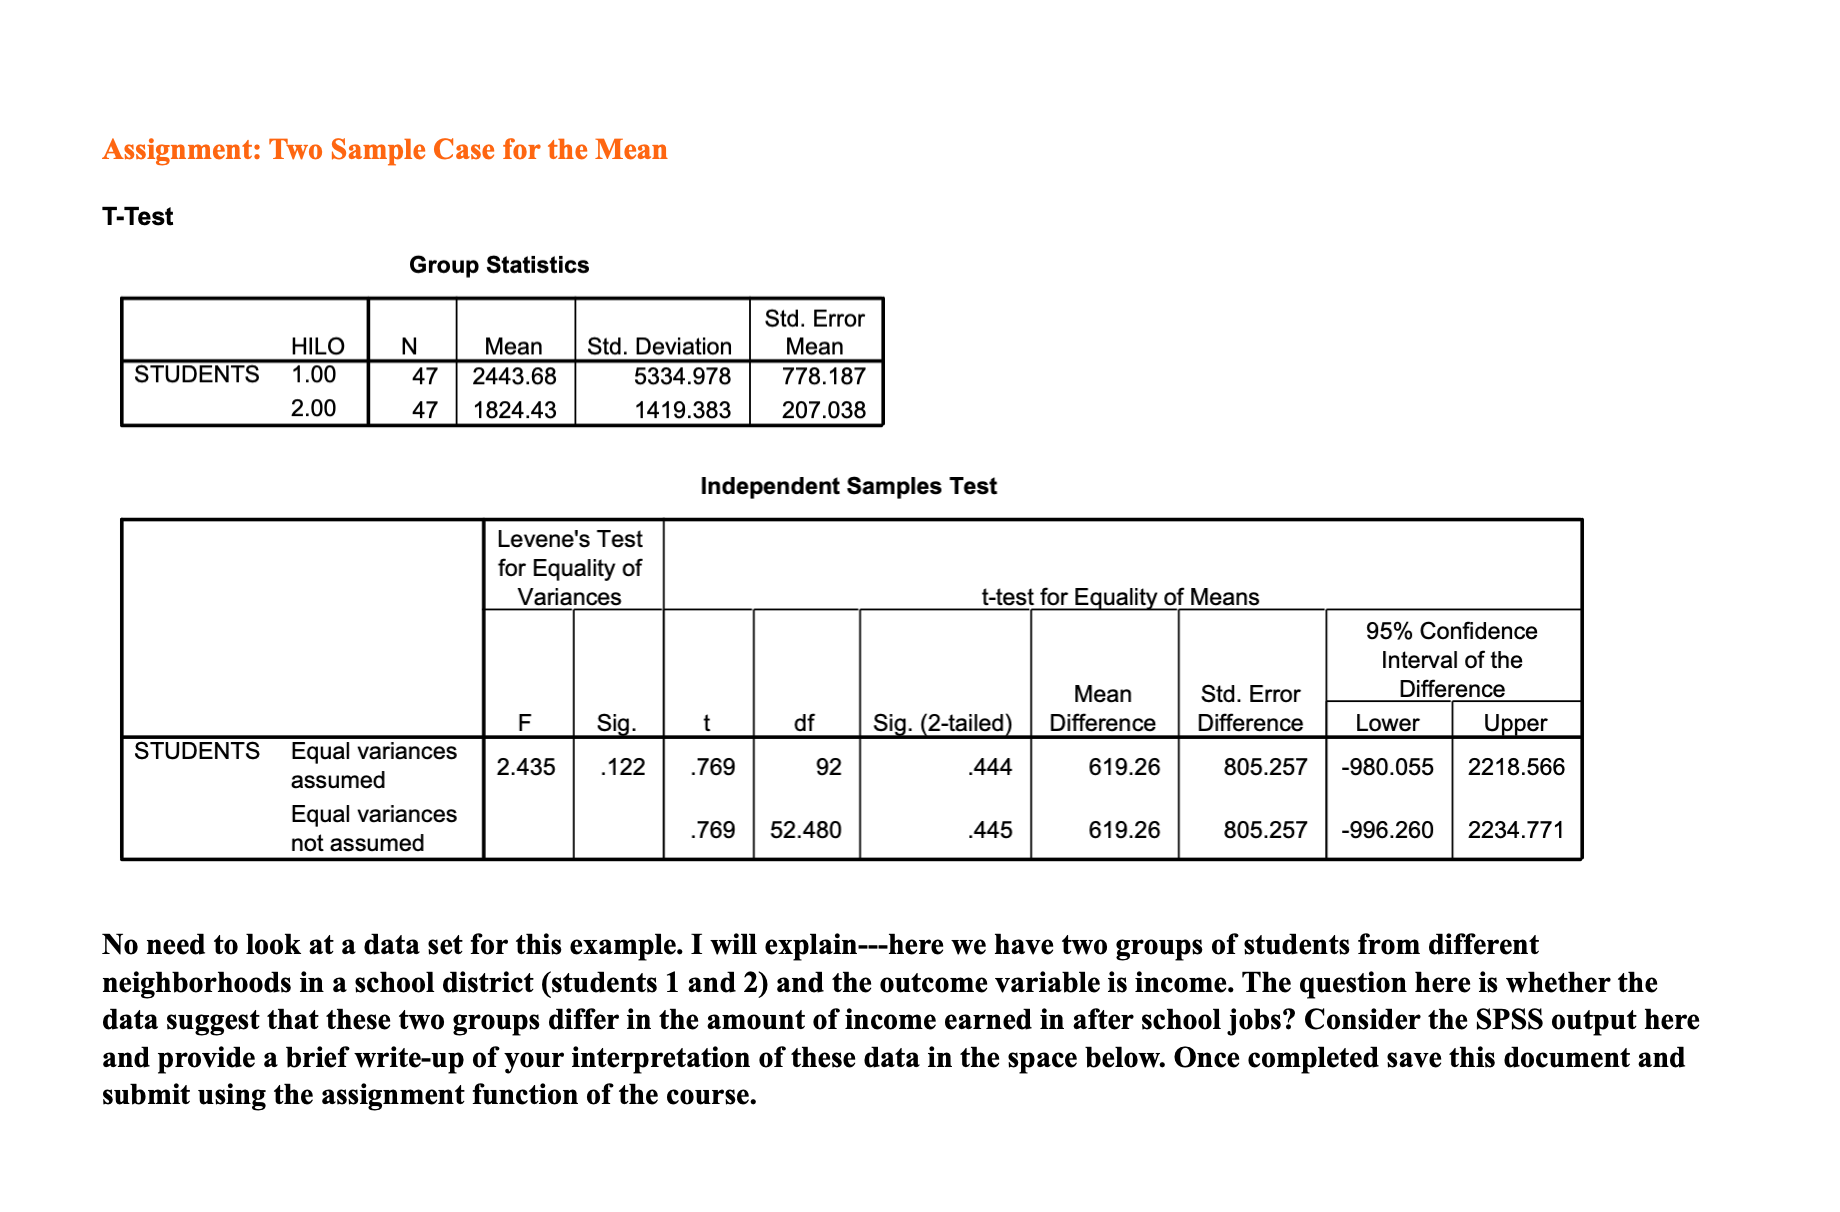
Assignment: Two Sample Case for the Mean T-Test Group Statistics I!I--- HILO Mean Std. Deviation Mean STUDENTS 1.00 47 2443.68 5334.973 778.187 2.00 47 1824.43 1419.383 207.038 Independent Samples Test Levene's Test for Equality of Variances ltest for E uali of Means 95% Condence Interval of the Mean Std. Error Difference F . t df n Difference Difference STUDENTS Equal variances assumed .122 .769 92 .444 619.26 805.257 -980.055 2218.566 Equal variances not assumed .769 52.480 .445 619.26 805.257 -996.260 2234.771 No need to look at a data set for this example. I will explainhere we have two groups of students from different neighborhoods in a school district (students 1 and 2) and the outcome variable is income. The question here is Whether the data suggest that these two groups differ in the amount of income earned in after school jobs? Consider the SPSS output here and provide a brief write-up of your interpretation of these data in the space below. Once completed save this document and submit using the assignment function of the course
Step by Step Solution
There are 3 Steps involved in it

Get step-by-step solutions from verified subject matter experts