

Question: Does this regression have much explanatory power? Why or why not? (HINT: You need to cite 2 statistics to answer this question fully.) Please do
- Does this regression have much explanatory power? Why or why not? (HINT: You need to cite 2 statistics to answer this question fully.) Please do this for both tables for small cap and gold.
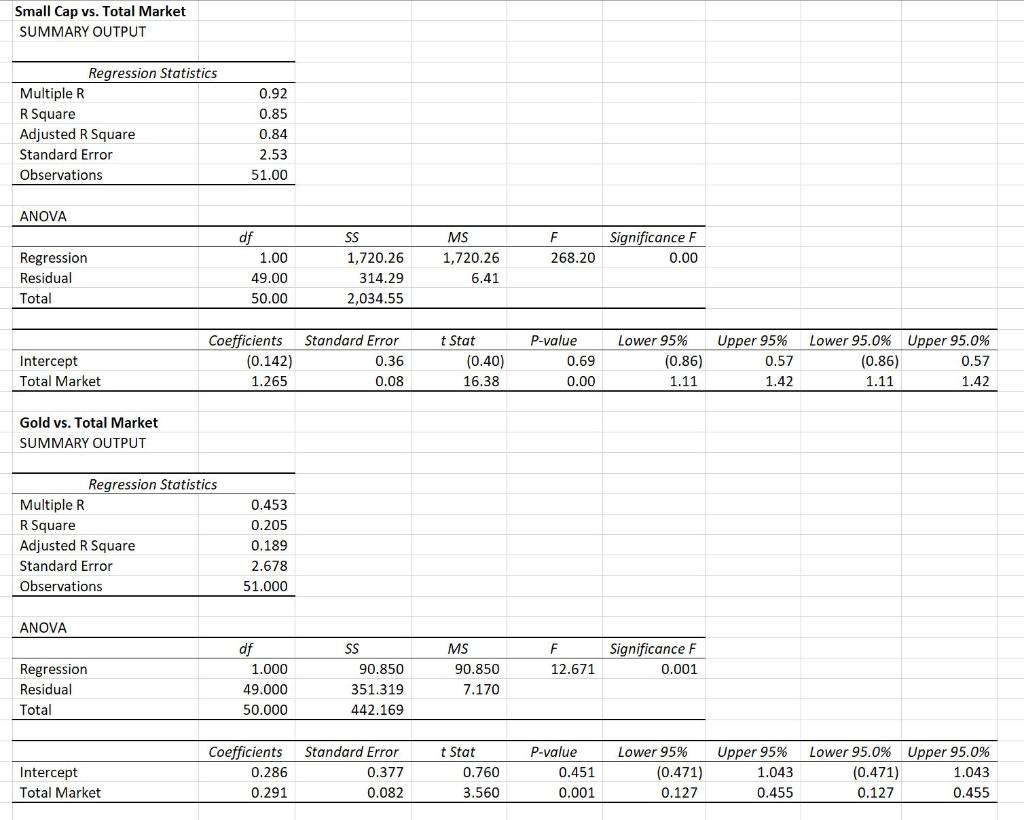
Small Cap vs. Total Market SUMMARY OUTPUT Regression Statistics Multiple R R Square Adjusted R Square Standard Error Observations 0.92 0.85 0.84 2.53 51.00 ANOVA Significance F F 268.20 Regression Residual Total 0.00 df 1.00 49.00 50.00 MS 1,720.26 6.41 SS 1,720.26 314.29 2,034.55 Coefficients (0.142) 1.265 Intercept Total Market Standard Error 0.36 0.08 t Stat (0.40) 16.38 P-value 0.69 0.00 Lower 95% (0.86) 1.11 Upper 95% 0.57 1.42 Lower 95.0% Upper 95.0% 0.57 1.11 1.42 (0.86) Gold vs. Total Market SUMMARY OUTPUT Regression Statistics Multiple R R Square Adjusted R Square Standard Error Observations 0.453 0.205 0.189 2.678 51.000 ANOVA F 12.671 Significance F 0.001 Regression Residual Total df 1.000 49.000 50.000 MS 90.850 7.170 SS 90.850 351.319 442.169 Intercept Total Market Coefficients 0.286 0.291 Standard Error 0.377 0.082 t Stat 0.760 3.560 P-value 0.451 0.001 Lower 95% (0.471) 0.127 Upper 95% 1.043 0.455 Lower 95.0% Upper 95.0% (0.471) 1.043 0.127 0.455 Small Cap vs. Total Market SUMMARY OUTPUT Regression Statistics Multiple R R Square Adjusted R Square Standard Error Observations 0.92 0.85 0.84 2.53 51.00 ANOVA Significance F F 268.20 Regression Residual Total 0.00 df 1.00 49.00 50.00 MS 1,720.26 6.41 SS 1,720.26 314.29 2,034.55 Coefficients (0.142) 1.265 Intercept Total Market Standard Error 0.36 0.08 t Stat (0.40) 16.38 P-value 0.69 0.00 Lower 95% (0.86) 1.11 Upper 95% 0.57 1.42 Lower 95.0% Upper 95.0% 0.57 1.11 1.42 (0.86) Gold vs. Total Market SUMMARY OUTPUT Regression Statistics Multiple R R Square Adjusted R Square Standard Error Observations 0.453 0.205 0.189 2.678 51.000 ANOVA F 12.671 Significance F 0.001 Regression Residual Total df 1.000 49.000 50.000 MS 90.850 7.170 SS 90.850 351.319 442.169 Intercept Total Market Coefficients 0.286 0.291 Standard Error 0.377 0.082 t Stat 0.760 3.560 P-value 0.451 0.001 Lower 95% (0.471) 0.127 Upper 95% 1.043 0.455 Lower 95.0% Upper 95.0% (0.471) 1.043 0.127 0.455
Step by Step Solution
There are 3 Steps involved in it

Get step-by-step solutions from verified subject matter experts