

Question: Dollars AH E MO K ATC MC F - 1 - - 0 Q2 Q3 MR Quantity of Output In the above figure, the distance
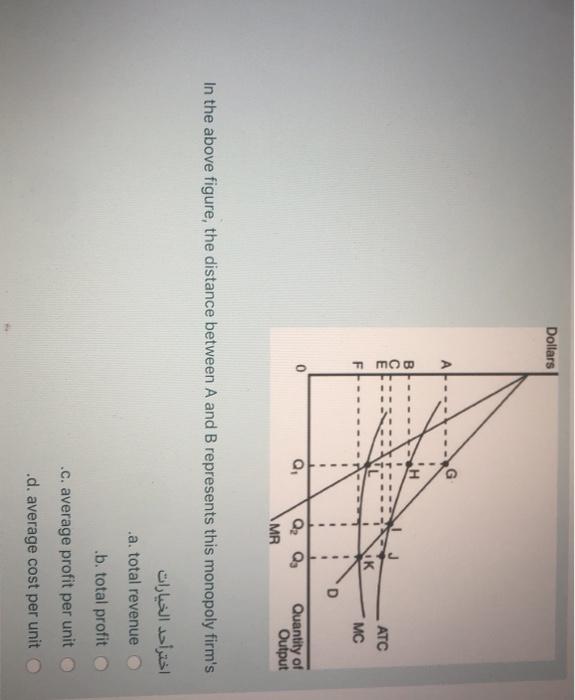
Dollars AH E MO K ATC MC F - 1 - - 0 Q2 Q3 MR Quantity of Output In the above figure, the distance between A and B represents this monopoly firm's .a. total revenue .b. total profit ... average profit per unit .d. average cost per unit
Step by Step Solution
There are 3 Steps involved in it
1 Expert Approved Answer
Step: 1 Unlock

Question Has Been Solved by an Expert!
Get step-by-step solutions from verified subject matter experts
Step: 2 Unlock
Step: 3 Unlock