

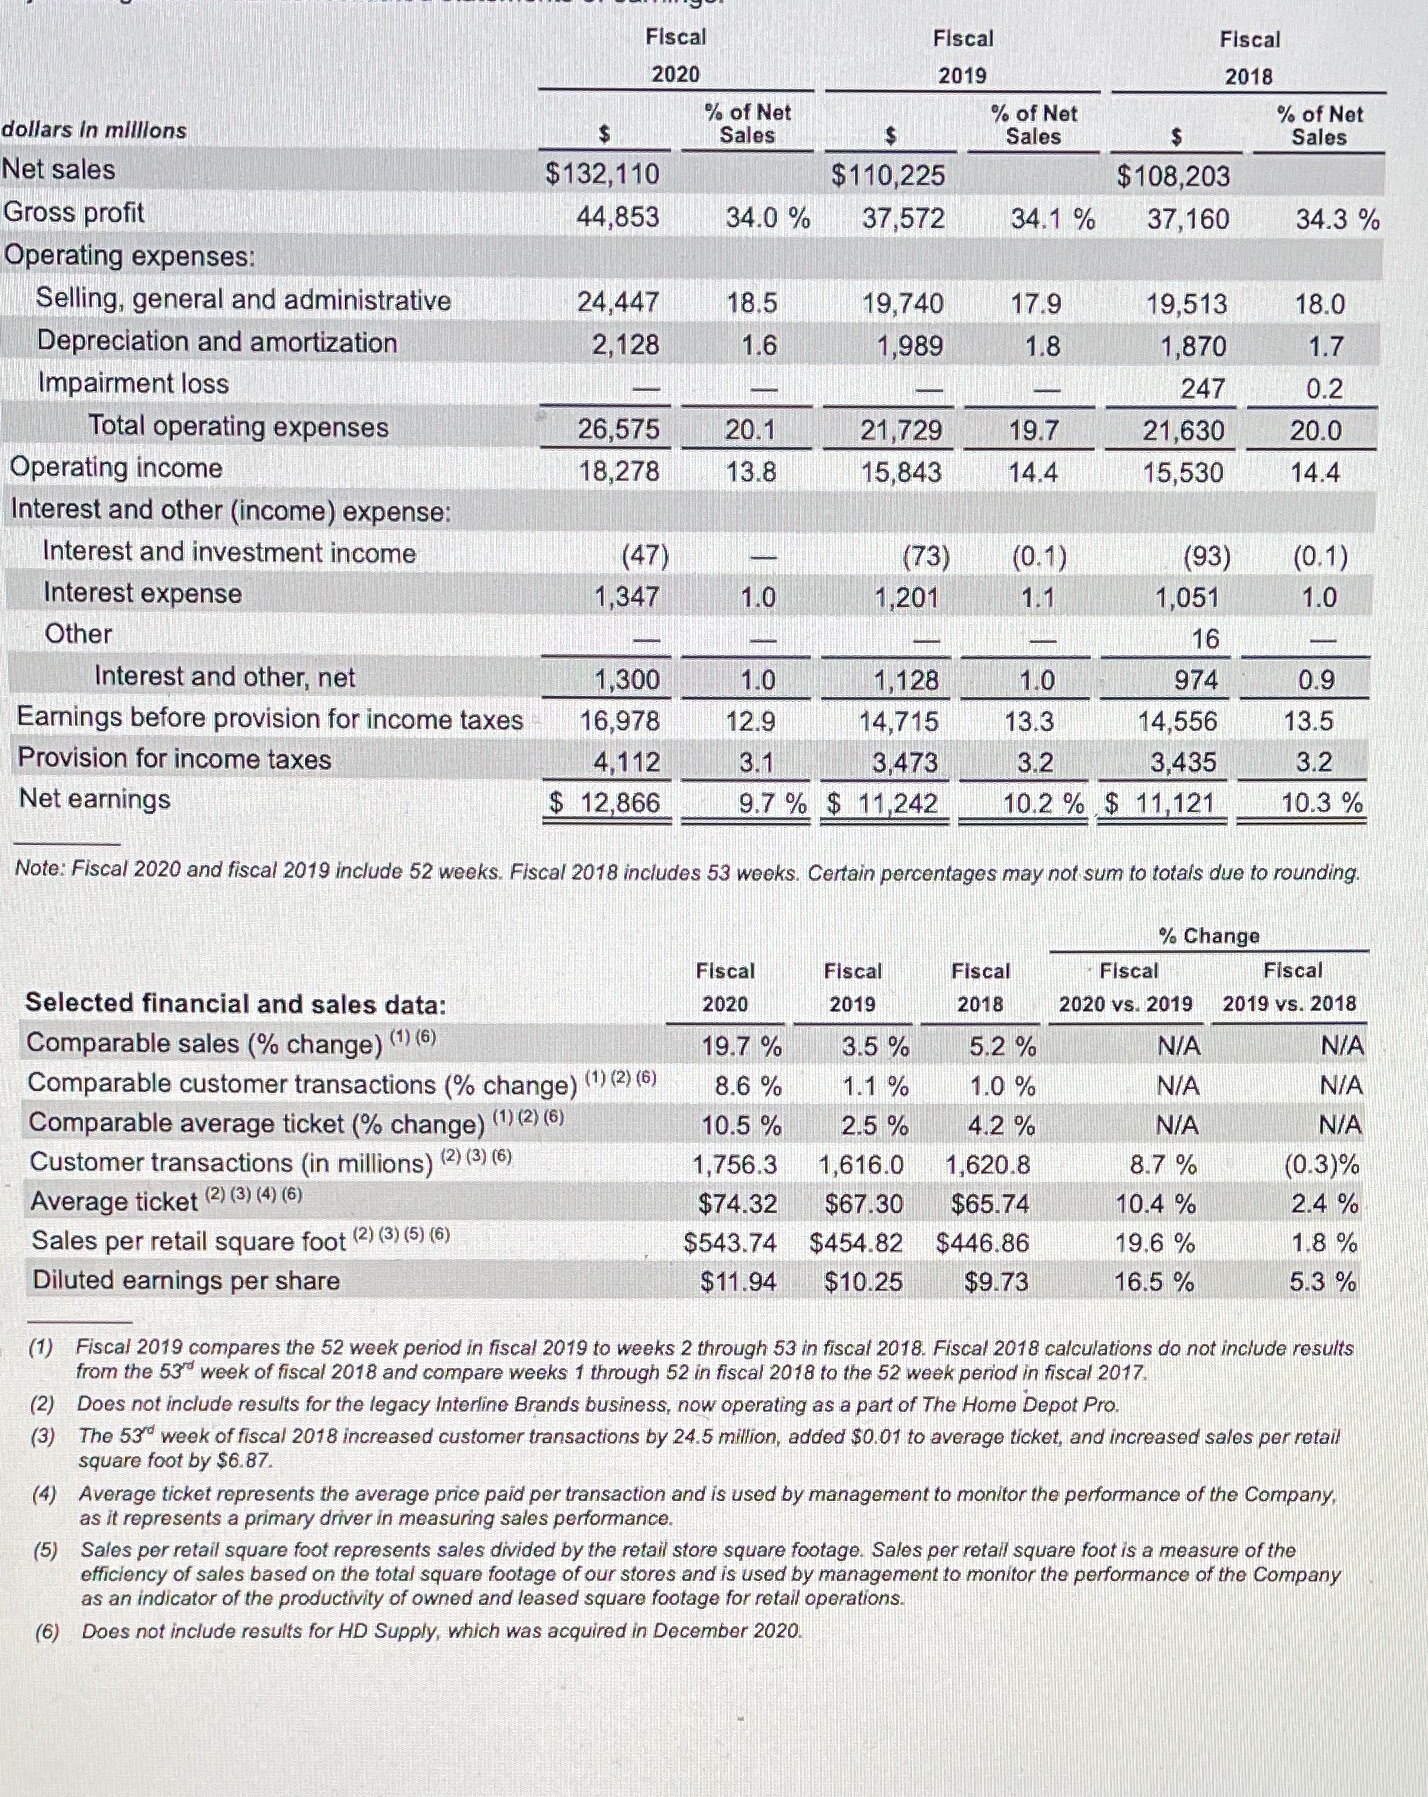
dollars in millions Net sales Gross profit Operating expenses: Selling, general and administrative Depreciation and amortization...
Fantastic news! We've Found the answer you've been seeking!
Question:
Expert Answer:
It seems like you have provided a table of financial data for a company possibly related to fiscal years 2018 2019 and 2020 Heres a breakdown of the i... View the full answer

Related Book For 
Understanding Financial Accounting
ISBN: 978-1118849385
1st Canadian Edition
Authors: Christopher Burnley, Robert Hoskin, Maureen Fizzell, Donald
Posted Date:
