

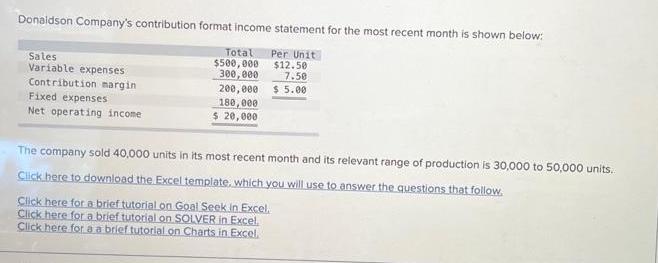
Donaldson Company's contribution format income statement for the most recent month is shown below: Per Unit...
Fantastic news! We've Found the answer you've been seeking!
Question:
Transcribed Image Text:
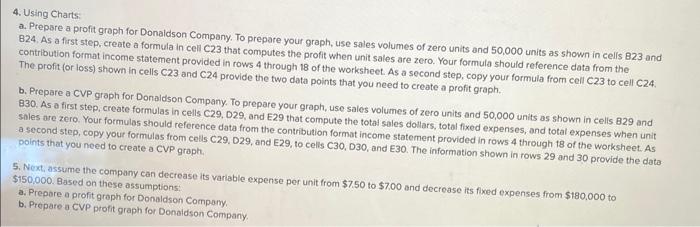
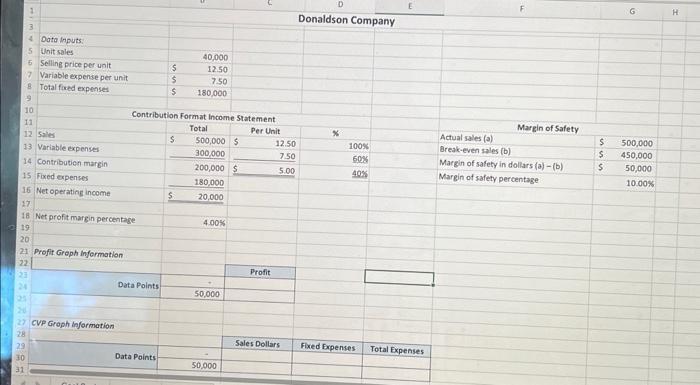
Donaldson Company's contribution format income statement for the most recent month is shown below: Per Unit $12.50 7.50 $5.00 Sales Variable expenses Contribution margin Fixed expenses Net operating income Total $500,000 300,000 200,000 180,000 $ 20,000 The company sold 40,000 units in its most recent month and its relevant range of production is 30,000 to 50,000 units. Click here to download the Excel template, which you will use to answer the questions that follow. Click here for a brief tutorial on Goal Seek in Excel. Click here for a brief tutorial on SOLVER in Excel. Click here for a a brief tutorial on Charts in Excel, 4. Using Charts: a. Prepare a profit graph for Donaldson Company. To prepare your graph, use sales volumes of zero units and 50,000 units as shown in cells 823 and 824. As a first step, create a formula in cell C23 that computes the profit when unit sales are zero. Your formula should reference data from the contribution format income statement provided in rows 4 through 18 of the worksheet. As a second step, copy your formula from cell C23 to cell C24. The profit (or loss) shown in cells C23 and C24 provide the two data points that you need to create a profit graph. b. Prepare a CVP graph for Donaldson Company. To prepare your graph, use sales volumes of zero units and 50,000 units as shown in cells 829 and 830. As a first step, create formulas in cells C29, D29, and E29 that compute the total sales dollars, total fixed expenses, and total expenses when unit sales are zero. Your formulas should reference data from the contribution format income statement provided in rows 4 through 18 of the worksheet. As a second step, copy your formulas from cells C29, D29, and E29, to cells C30, D30, and E30. The information shown in rows 29 and 30 provide the data points that you need to create a CVP graph. 5. Next, assume the company can decrease its variable expense per unit from $7.50 to $7.00 and decrease its fixed expenses from $180,000 to $150,000. Based on these assumptions: a. Prepare a profit graph for Donaldson Company. b. Prepare a CVP profit graph for Donaldson Company. 1 3 4 5 Data Inputs Unit sales 6 Selling price per unit 27 Variable expense per unit 8 Total fixed expenses 9 10 11 12 Sales 13 Variable expenses 14 Contribution margin 15 Fixed expenses 29 30 31 16 Net operating income 17 18 Net profit margin percentage 19 20 21 Profit Graph Information 22 23 27 CVP Graph Information Contribution Format Income Statement Total Per Unit Data Points $ $ $ Data Points $ 40,000 12.50 7.50 180,000 $ 500,000 $ 300,000 200,000 $ 180,000 20,000 4.00% 50,000 50,000 Profit 12.50 7.50 5.00 Sales Dollars Donaldson Company % 100% 60% 40% Fixed Expenses Total Expenses Margin of Safety Actual sales (a) Break-even sales (b) Margin of safety in dollars (a)-(b) Margin of safety percentage $ $ $ G 500,000 450,000 50,000 10.00% H Donaldson Company's contribution format income statement for the most recent month is shown below: Per Unit $12.50 7.50 $5.00 Sales Variable expenses Contribution margin Fixed expenses Net operating income Total $500,000 300,000 200,000 180,000 $ 20,000 The company sold 40,000 units in its most recent month and its relevant range of production is 30,000 to 50,000 units. Click here to download the Excel template, which you will use to answer the questions that follow. Click here for a brief tutorial on Goal Seek in Excel. Click here for a brief tutorial on SOLVER in Excel. Click here for a a brief tutorial on Charts in Excel, 4. Using Charts: a. Prepare a profit graph for Donaldson Company. To prepare your graph, use sales volumes of zero units and 50,000 units as shown in cells 823 and 824. As a first step, create a formula in cell C23 that computes the profit when unit sales are zero. Your formula should reference data from the contribution format income statement provided in rows 4 through 18 of the worksheet. As a second step, copy your formula from cell C23 to cell C24. The profit (or loss) shown in cells C23 and C24 provide the two data points that you need to create a profit graph. b. Prepare a CVP graph for Donaldson Company. To prepare your graph, use sales volumes of zero units and 50,000 units as shown in cells 829 and 830. As a first step, create formulas in cells C29, D29, and E29 that compute the total sales dollars, total fixed expenses, and total expenses when unit sales are zero. Your formulas should reference data from the contribution format income statement provided in rows 4 through 18 of the worksheet. As a second step, copy your formulas from cells C29, D29, and E29, to cells C30, D30, and E30. The information shown in rows 29 and 30 provide the data points that you need to create a CVP graph. 5. Next, assume the company can decrease its variable expense per unit from $7.50 to $7.00 and decrease its fixed expenses from $180,000 to $150,000. Based on these assumptions: a. Prepare a profit graph for Donaldson Company. b. Prepare a CVP profit graph for Donaldson Company. 1 3 4 5 Data Inputs Unit sales 6 Selling price per unit 27 Variable expense per unit 8 Total fixed expenses 9 10 11 12 Sales 13 Variable expenses 14 Contribution margin 15 Fixed expenses 29 30 31 16 Net operating income 17 18 Net profit margin percentage 19 20 21 Profit Graph Information 22 23 27 CVP Graph Information Contribution Format Income Statement Total Per Unit Data Points $ $ $ Data Points $ 40,000 12.50 7.50 180,000 $ 500,000 $ 300,000 200,000 $ 180,000 20,000 4.00% 50,000 50,000 Profit 12.50 7.50 5.00 Sales Dollars Donaldson Company % 100% 60% 40% Fixed Expenses Total Expenses Margin of Safety Actual sales (a) Break-even sales (b) Margin of safety in dollars (a)-(b) Margin of safety percentage $ $ $ G 500,000 450,000 50,000 10.00% H
Expert Answer:

Related Book For 
Introduction to Managerial Accounting
ISBN: 978-0078025792
7th edition
Authors: Peter Brewer, Ray Garrison, Eric Noreen
Posted Date:
Students also viewed these accounting questions
-
Donaldson Company's contribution format income statement for the most recent month is shown below: Per Unit $12.50 7.50 Total Sales $500,000 300,000 Variable expenses Contribution margin $ 5.00...
-
Miller Company's contribution format income statement for the most recent month is shown below Sales (42,000 units) Variable expenses Contribution margin Fixed expenses Net operating income Total $...
-
Please help with question 5b !!! Please help with question 3 !!! Due to erratic sales of its sole product-a high-capacity battery for laptop computers-PEM, Inc., has been experiencing financial...
-
Data was collected for a sample of organic snacks. The amount of sugar (in mg) in each snack is summarized in the histogram below. Frequency 12 -10 8 6 4 2 n = 180 200 220 240 260 280 300 320 amount...
-
Lyle and Fisher are partners, sharing gains and losses equally. They decide to terminate their partnership. Prior to realization, their capital balances are $15,000 and $7,000, respectively. After...
-
Morrow Corporation had only one job in process during May-Job X32Z-and had no finished goods inventory on May 1. Job X32Z was started in April and finished during May, Data concerning that job appear...
-
The force P applied at joint D of the square frame causes the frame to sway and form the dashed rhombus. Determine the average normal strain developed in wire AE. Assume the three rods are rigid....
-
Boston Clothing Limited was a private company that experienced cash flow difficulties and hired new management to turn the company around. The company then went public and the shares sold at $15 per...
-
A circular aperture is lit up by a laser with wavelength 565 nm. The central maximum on the screen 50.0 cm away has the same diameter as the circular aperture. What is the diameter of the circular...
-
1. Which process should VBB choose to produce?? 2. How much would VBP be willing to pay for the testing that is currently offered, for each batch?? 3. Would we be considered a perfect test, at twice...
-
The database BreastCancer_Wisconsin: .. _breast_cancer_dataset: Breast cancer wisconsin (diagnostic) dataset -------------------------------------------- **Data Set Characteristics:** :Number of...
-
The manager repeated again his warning that we must use strong passwords. Your Task . Revise the following sentences to avoid redundancies.
-
Zakat is payable only on growing capital. Growing capital is a. a fixed asset that can be expanded. b. the realised gains on fixed assets. c. the realised and unrealised gains on fixed assets. d. the...
-
Orange Furniture Inc. (Orange) imports pine furniture from factories around the world for sale to retailers in Canada. On October 31, 2004, Orange bought a bedroom furniture set from a supplier in...
-
What proportion of Canadian employment is in non-profit organizations?
-
Christopher Sanchez is Regional Manager at Digital Depot in New Orleans, Louisiana. He received an e-mail from Thomas Heffernan, a frustrated customer who is demanding a steep price match for all his...
-
Factor the polynomial completely. Q(x)=x-256 Q(x) = Find all its zeros. State the multiplicity of each zero. (Order your answers from smallest to largest real, followed by complex answers ordered...
-
On 1 July 2021, Croydon Ltd leased ten excavators for five years from Machines4U Ltd. The excavators are expected to have an economic life of 6 years, after which time they will have an expected...
-
Markus Company's common stock sold for $2.75 per share at the end of this year. The company paid a common stock dividend of $0.55 per share this year. It also provided the following data excerpts...
-
Gino's Restaurant is a popular restaurant in Boston, Massachusetts. The owner of the restaurant has been trying to better understand costs at the restaurant and has hired a student intern to conduct...
-
Comparative financial statements for Weaver Company follow: During 2015, Weaver sold some equipment for $20 that had cost $40 and on which there was accumulated depreciation of $16. In addition, the...
-
Speeds of bullet trains. Determine whether the data are qualitative or quantitative. Explain your reasoning.
-
Widths of veins in different species of leaves. Determine whether the data are qualitative or quantitative. Explain your reasoning.
-
American Standard Code for Information Interchange (ASCII) codes. Determine whether the data are qualitative or quantitative. Explain your reasoning.

Study smarter with the SolutionInn App