

Question: Download the data from the following data table a. Compute the average return for each of the assets from 1929 to 1940 (the Great Depression).
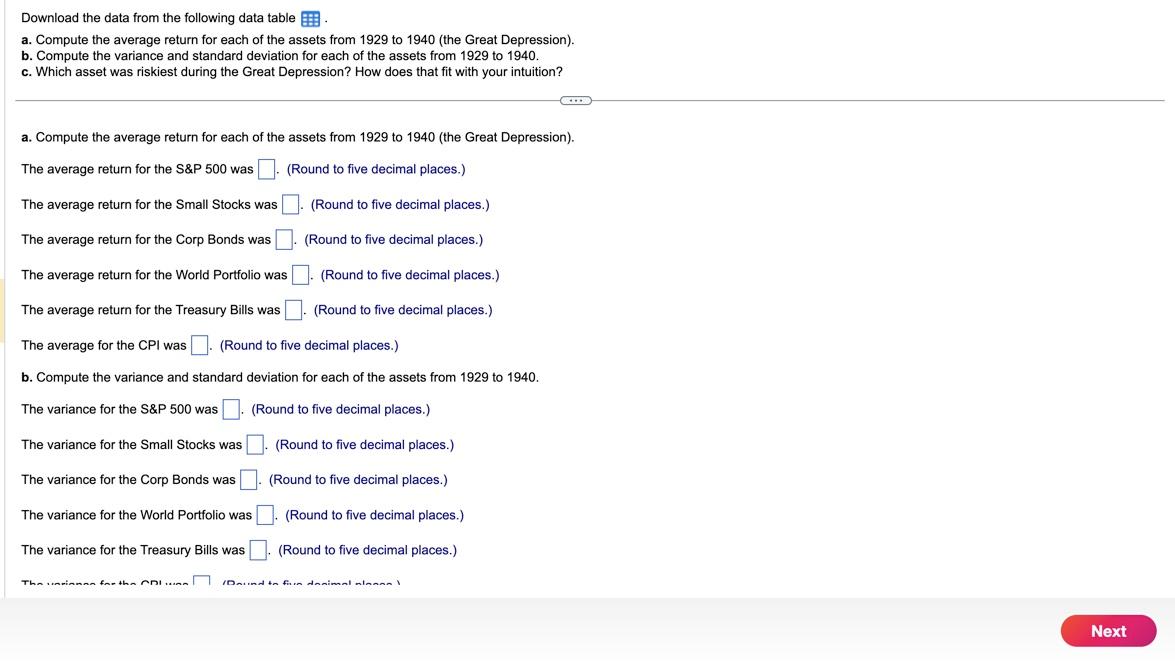
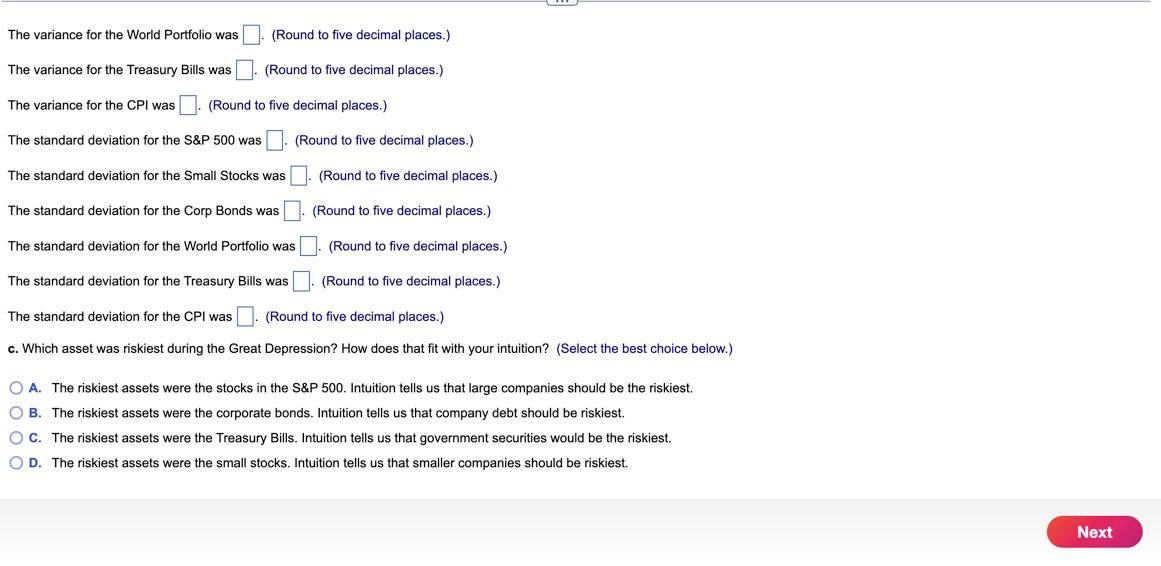
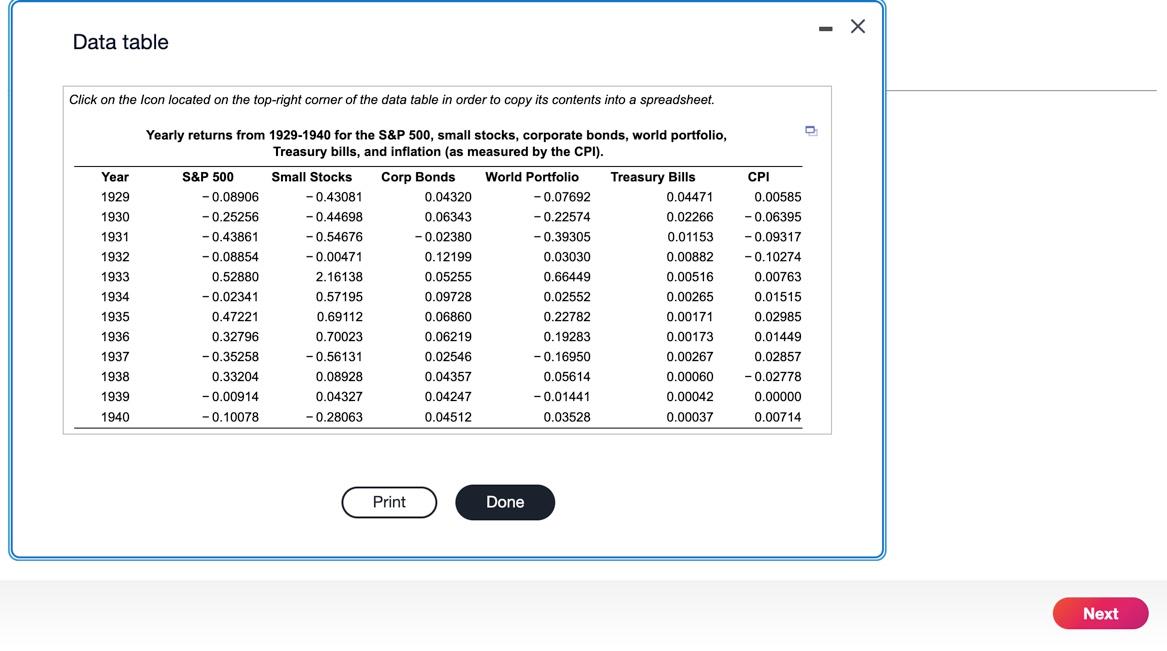
Download the data from the following data table a. Compute the average return for each of the assets from 1929 to 1940 (the Great Depression). b. Compute the variance and standard deviation for each of the assets from 1929 to 1940. c. Which asset was riskiest during the Great Depression? How does that fit with your intuition? a. Compute the average return for each of the assets from 1929 to 1940 (the Great Depression). The average return for the S\&P 500 was (Round to five decimal places.) The average return for the Small Stocks was . (Round to five decimal places.) The average return for the Corp Bonds was (Round to five decimal places.) The average return for the World Portfolio was (Round to five decimal places.) The average return for the Treasury Bills was (Round to five decimal places.) The average for the CPI was (Round to five decimal places.) b. Compute the variance and standard deviation for each of the assets from 1929 to 1940. The variance for the S\&P 500 was (Round to five decimal places.) The variance for the Small Stocks was . (Round to five decimal places.) The variance for the Corp Bonds was . (Round to five decimal places.) The variance for the World Portfolio was (Round to five decimal places.) The variance for the Treasury Bills was (Round to five decimal places.) The variance for the World Portfolio was (Round to five decimal places.) The variance for the Treasury Bills was (Round to five decimal places.) The variance for the CPI was (Round to five decimal places.) The standard deviation for the S\&P 500 was (Round to five decimal places.) The standard deviation for the Small Stocks was (Round to five decimal places.) The standard deviation for the Corp Bonds was (Round to five decimal places.) The standard deviation for the World Portfolio was . (Round to five decimal places.) The standard deviation for the Treasury Bills was . (Round to five decimal places.) The standard deviation for the CPI was (Round to five decimal places.) Data table Click on the Icon located on the top-right corner of the data table in order to copy its contents into a spreadsheet. Yearly returns from 1929-1940 for the S\&P 500, small stocks, corporate bonds, world portfolio, Download the data from the following data table a. Compute the average return for each of the assets from 1929 to 1940 (the Great Depression). b. Compute the variance and standard deviation for each of the assets from 1929 to 1940. c. Which asset was riskiest during the Great Depression? How does that fit with your intuition? a. Compute the average return for each of the assets from 1929 to 1940 (the Great Depression). The average return for the S\&P 500 was (Round to five decimal places.) The average return for the Small Stocks was . (Round to five decimal places.) The average return for the Corp Bonds was (Round to five decimal places.) The average return for the World Portfolio was (Round to five decimal places.) The average return for the Treasury Bills was (Round to five decimal places.) The average for the CPI was (Round to five decimal places.) b. Compute the variance and standard deviation for each of the assets from 1929 to 1940. The variance for the S\&P 500 was (Round to five decimal places.) The variance for the Small Stocks was . (Round to five decimal places.) The variance for the Corp Bonds was . (Round to five decimal places.) The variance for the World Portfolio was (Round to five decimal places.) The variance for the Treasury Bills was (Round to five decimal places.) The variance for the World Portfolio was (Round to five decimal places.) The variance for the Treasury Bills was (Round to five decimal places.) The variance for the CPI was (Round to five decimal places.) The standard deviation for the S\&P 500 was (Round to five decimal places.) The standard deviation for the Small Stocks was (Round to five decimal places.) The standard deviation for the Corp Bonds was (Round to five decimal places.) The standard deviation for the World Portfolio was . (Round to five decimal places.) The standard deviation for the Treasury Bills was . (Round to five decimal places.) The standard deviation for the CPI was (Round to five decimal places.) Data table Click on the Icon located on the top-right corner of the data table in order to copy its contents into a spreadsheet. Yearly returns from 1929-1940 for the S\&P 500, small stocks, corporate bonds, world portfolio
Step by Step Solution
There are 3 Steps involved in it

Get step-by-step solutions from verified subject matter experts