

Question: Drag each graph given below to its corresponding regression equation to the right 70 60 50 40 30 20 10 140 120 100 80 60
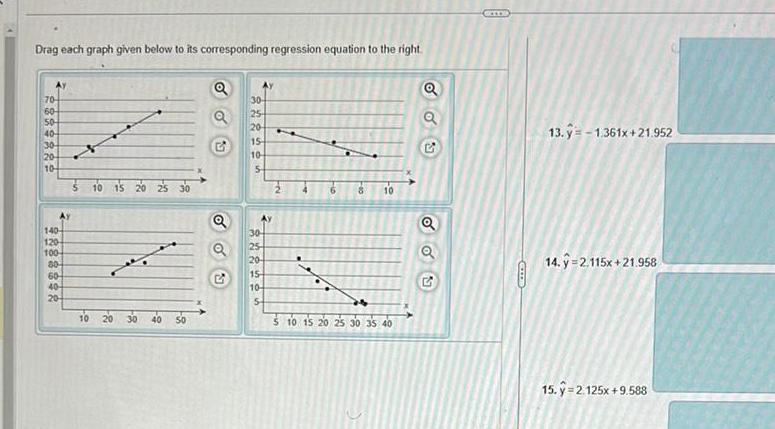

Drag each graph given below to its corresponding regression equation to the right 70 60 50 40 30 20 10 140 120 100 80 60 40 20 10 10 20 25 30 20 30 40 50 Q dou 30 25 84 20 15 10 5 30 202 25 20 15 10 5 N 5 10 15 8 10 24 25 30 35 40 O o 5 Q SOU Q C CCIDE 13 1 361x 21 952 14 y 2 115x 21 958 15 2 125x 9 588
Step by Step Solution
There are 3 Steps involved in it
1 Expert Approved Answer
Step: 1 Unlock

Question Has Been Solved by an Expert!
Get step-by-step solutions from verified subject matter experts
Step: 2 Unlock
Step: 3 Unlock