

Question: Draw a current state map based off of the below information that illustrates each of the following (see below for information): Customer(s) and Supplier(s) Identify
Draw a current state map based off of the below information that illustrates each of the following (see below for information):
- Customer(s) and Supplier(s)
- Identify customer(s) and/or suppliers(s) that are initiating this process.
- Map the Main Process Steps in Sequence
- Indicate the flow of information and material(s).
- Indicate the following metrics for each step
- Processing time (P/T)
- Lead time (L/T)
- Percentage complete and accurate (%C/A)
- Resource and % availability (if needed)
- Include a summary data box that includes the metrics for the entire process
- Processing time (P/T)
- Lead time (L/T)
- Percentage complete and accurate (%C/A)
- Activity ratio (calculated as the ratio of P/T and L/T)
Workers:
Joanie Meyer, Manager of Disbursements
Joanie oversaw four departments within accounting: The Sales and Use Tax Department; the Payroll, the Time, and Expense Reporting Department; the Accounts Payable Department
CEO, Henry Lee
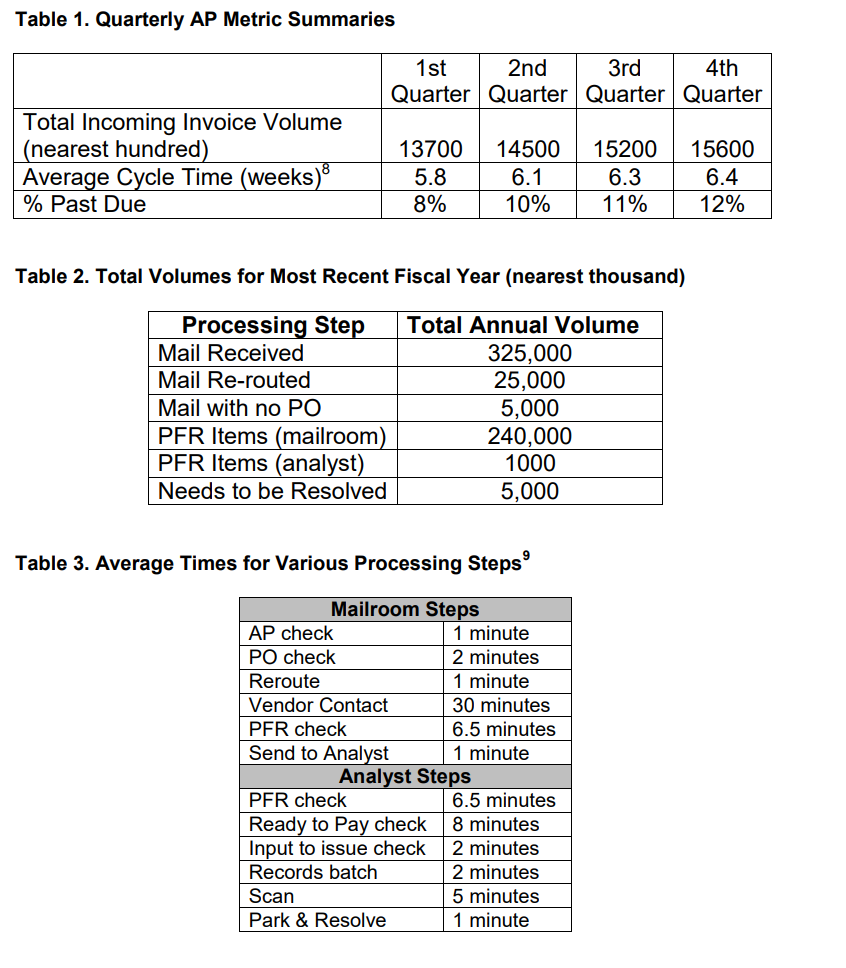
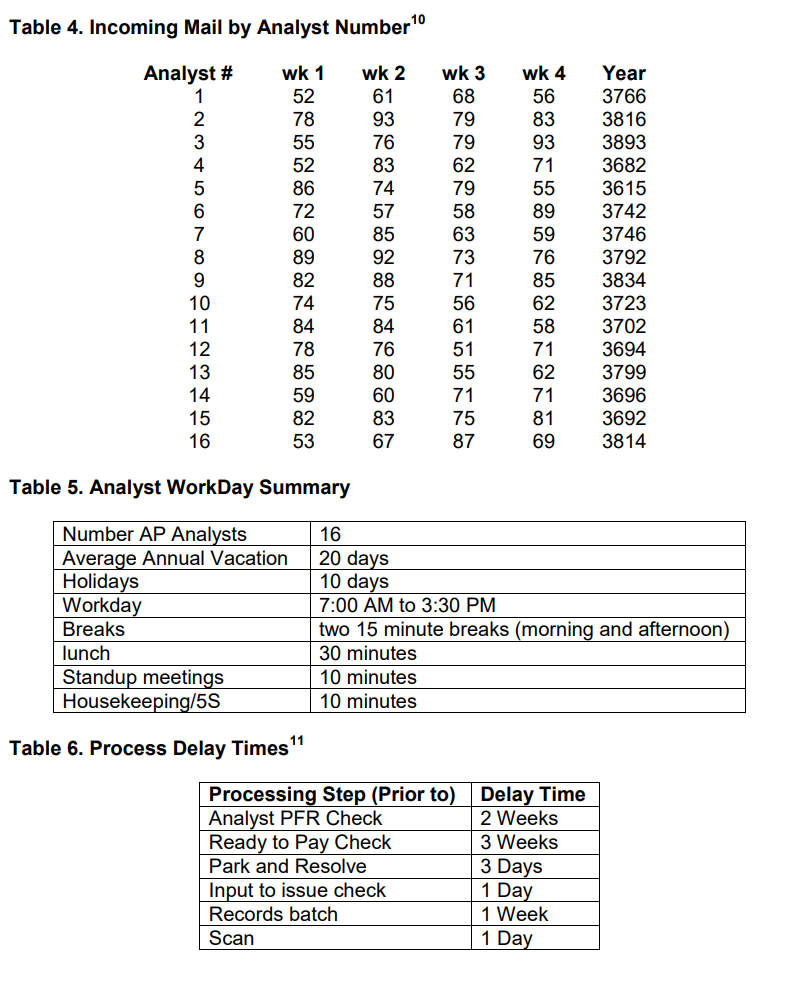
Table 1. Quarterly AP Metric Summaries Table 2. Total Volumes for Most Recent Fiscal Year (nearest thousand) Table 3. Average Times for Various Processing Steps 9 Table 4. Incoming Mail by Analyst Number 10 Table 5. Analyst WorkDay Summary Table 6. Process Delay Times 11
Step by Step Solution
There are 3 Steps involved in it

Get step-by-step solutions from verified subject matter experts