

Question: Draw a flowchart to describe the algorithm that calculate the sum of odd numbers and the average of even numbers between 5 0 to 7
Draw a flowchart to describe the algorithm that calculate the sum of odd numbers and the average of even numbers between to
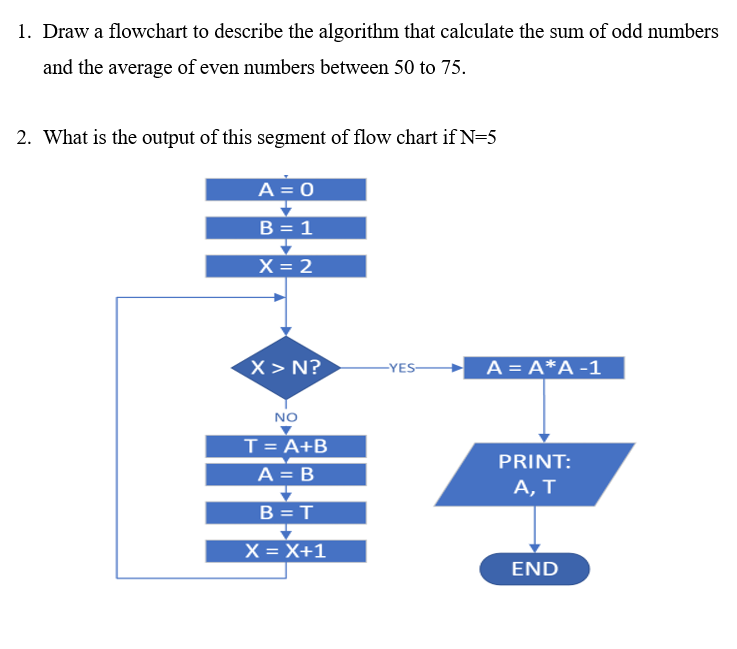
What is the output of this segment of flow chart if
Step by Step Solution
There are 3 Steps involved in it
1 Expert Approved Answer
Step: 1 Unlock

Question Has Been Solved by an Expert!
Get step-by-step solutions from verified subject matter experts
Step: 2 Unlock
Step: 3 Unlock