

Question: draw a graph and value of y data a Present the on using a graph X 19 14 16 12 8 IS 10 22 b.
draw a graph and value of y
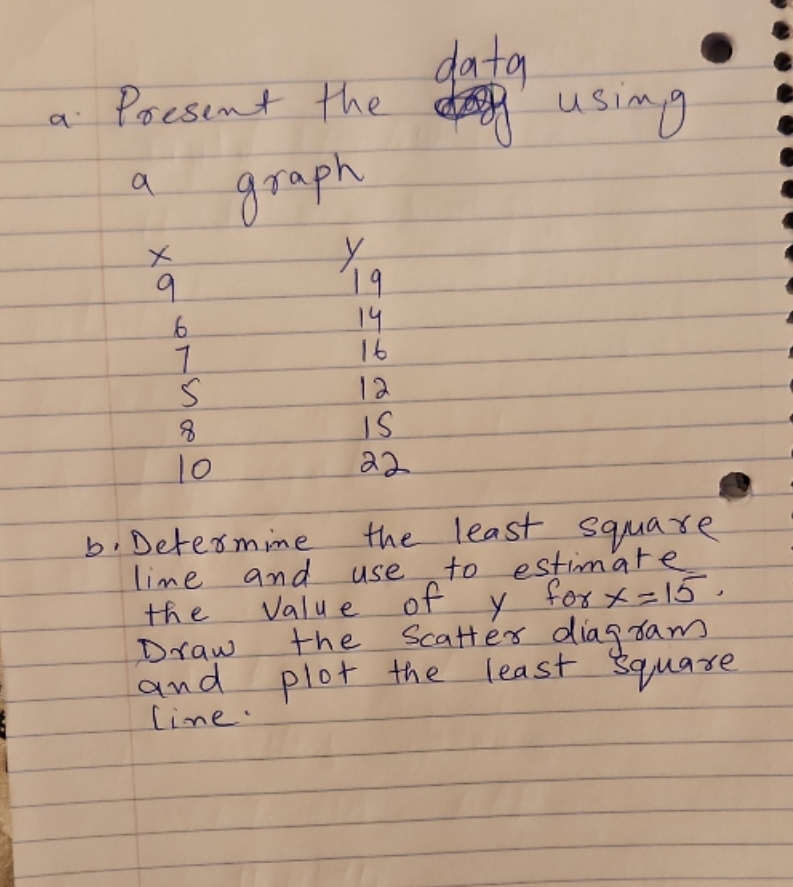
data a Present the on using a graph X 19 14 16 12 8 IS 10 22 b. Determine the least square lime and use to estimate the value of y foxx = 15 . Draw the Scatter diagrams and plot the least square Live
Step by Step Solution
There are 3 Steps involved in it
1 Expert Approved Answer
Step: 1 Unlock

Question Has Been Solved by an Expert!
Get step-by-step solutions from verified subject matter experts
Step: 2 Unlock
Step: 3 Unlock