

Question: Draw five conclusions from the dashboard using the slicers and graphs in combination Male Female Male Female Male Female HR Management Dashboard Total Empl 54%
Draw five conclusions from the dashboard using the slicers and graphs in combination
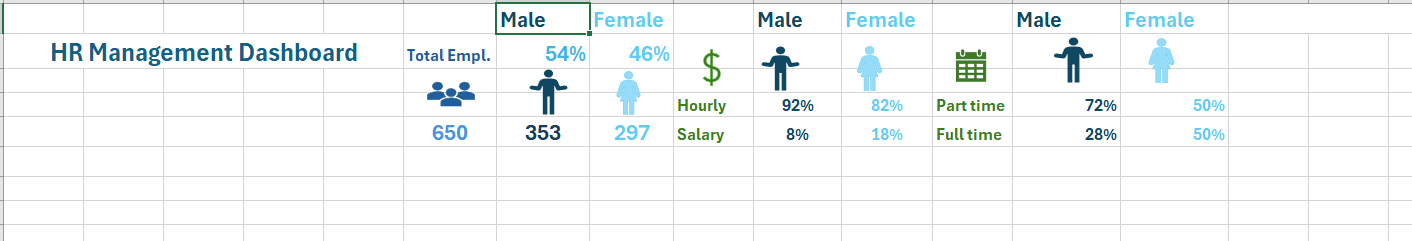
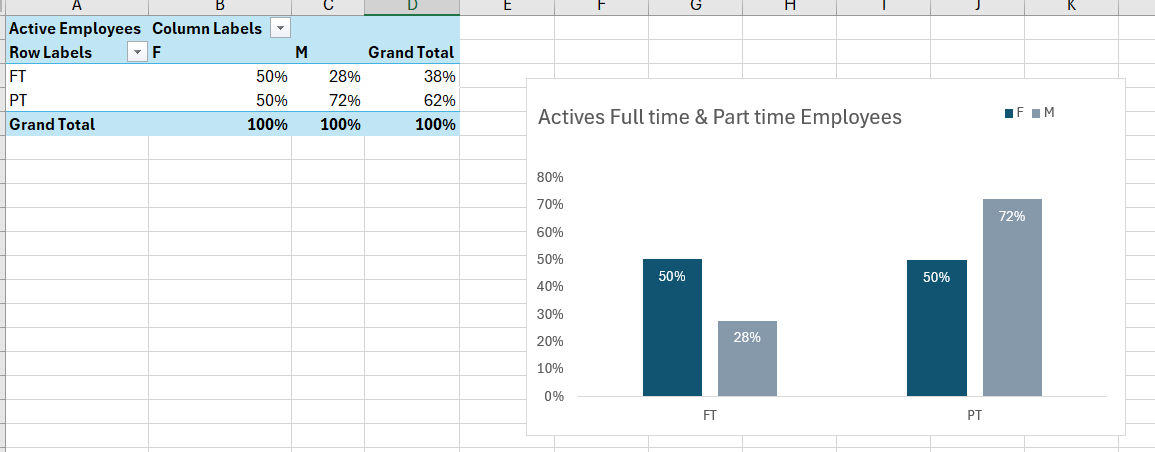
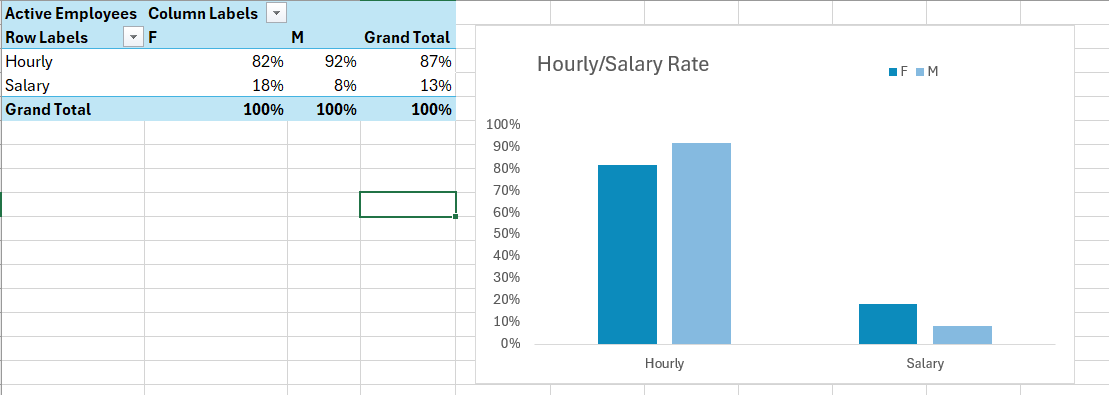
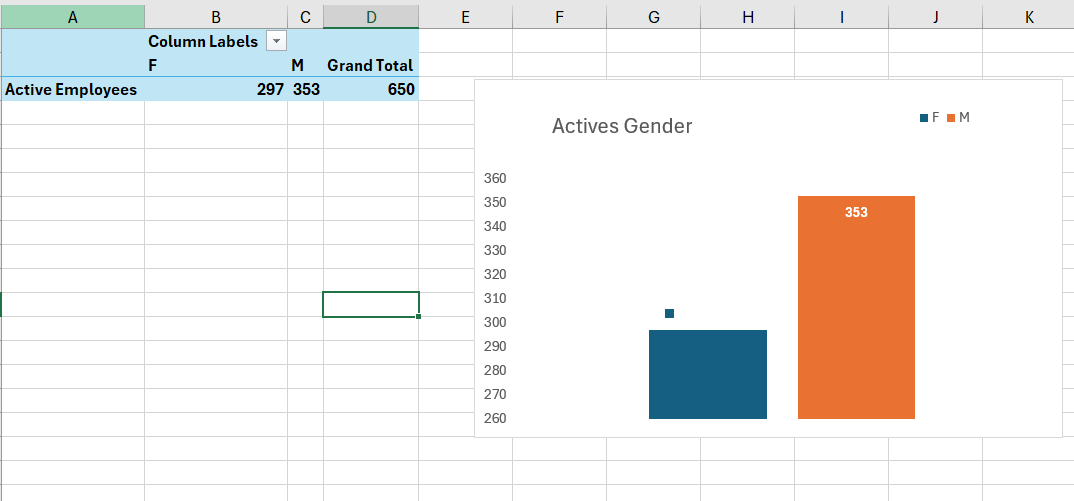
Male Female Male Female Male Female HR Management Dashboard Total Empl 54% 46% Hourly 92% 82% Part time 72% 50% 650 353 297 Salary 8% 18% Full time 28% 50%A B c| U | E r G H I J Active Employees Column Labels -~ Row Labels ~|F M Grand Total FT 50% 28% 38% PT 50% 72% 62% _ _ _ |Grand Totat 100% 100% 100% Actives Full time & Part time Employees mFa 80% i 70% 1 60% 1 50% i 40% 50% 30% 20% 10% i 0% Active Employees Column Labels |~ Rowlabels - F Grand Total Hourly 82% 92% 87% Salary 18% 8% 13% Grand Total 100% 100% 100% [ 1] 100% 30% 80% 70% 60% 50% 40% 30% 20% 10% 0% Hourly/Salary Rate Hourly mF mM Salary \f
Step by Step Solution
There are 3 Steps involved in it

Get step-by-step solutions from verified subject matter experts