Question: View 125% v Zoom e= @ mm QO Gl o Insert Table Chart Text Shape Media Share Name(s): Date: Lab #3 Measures of Position, Correlation
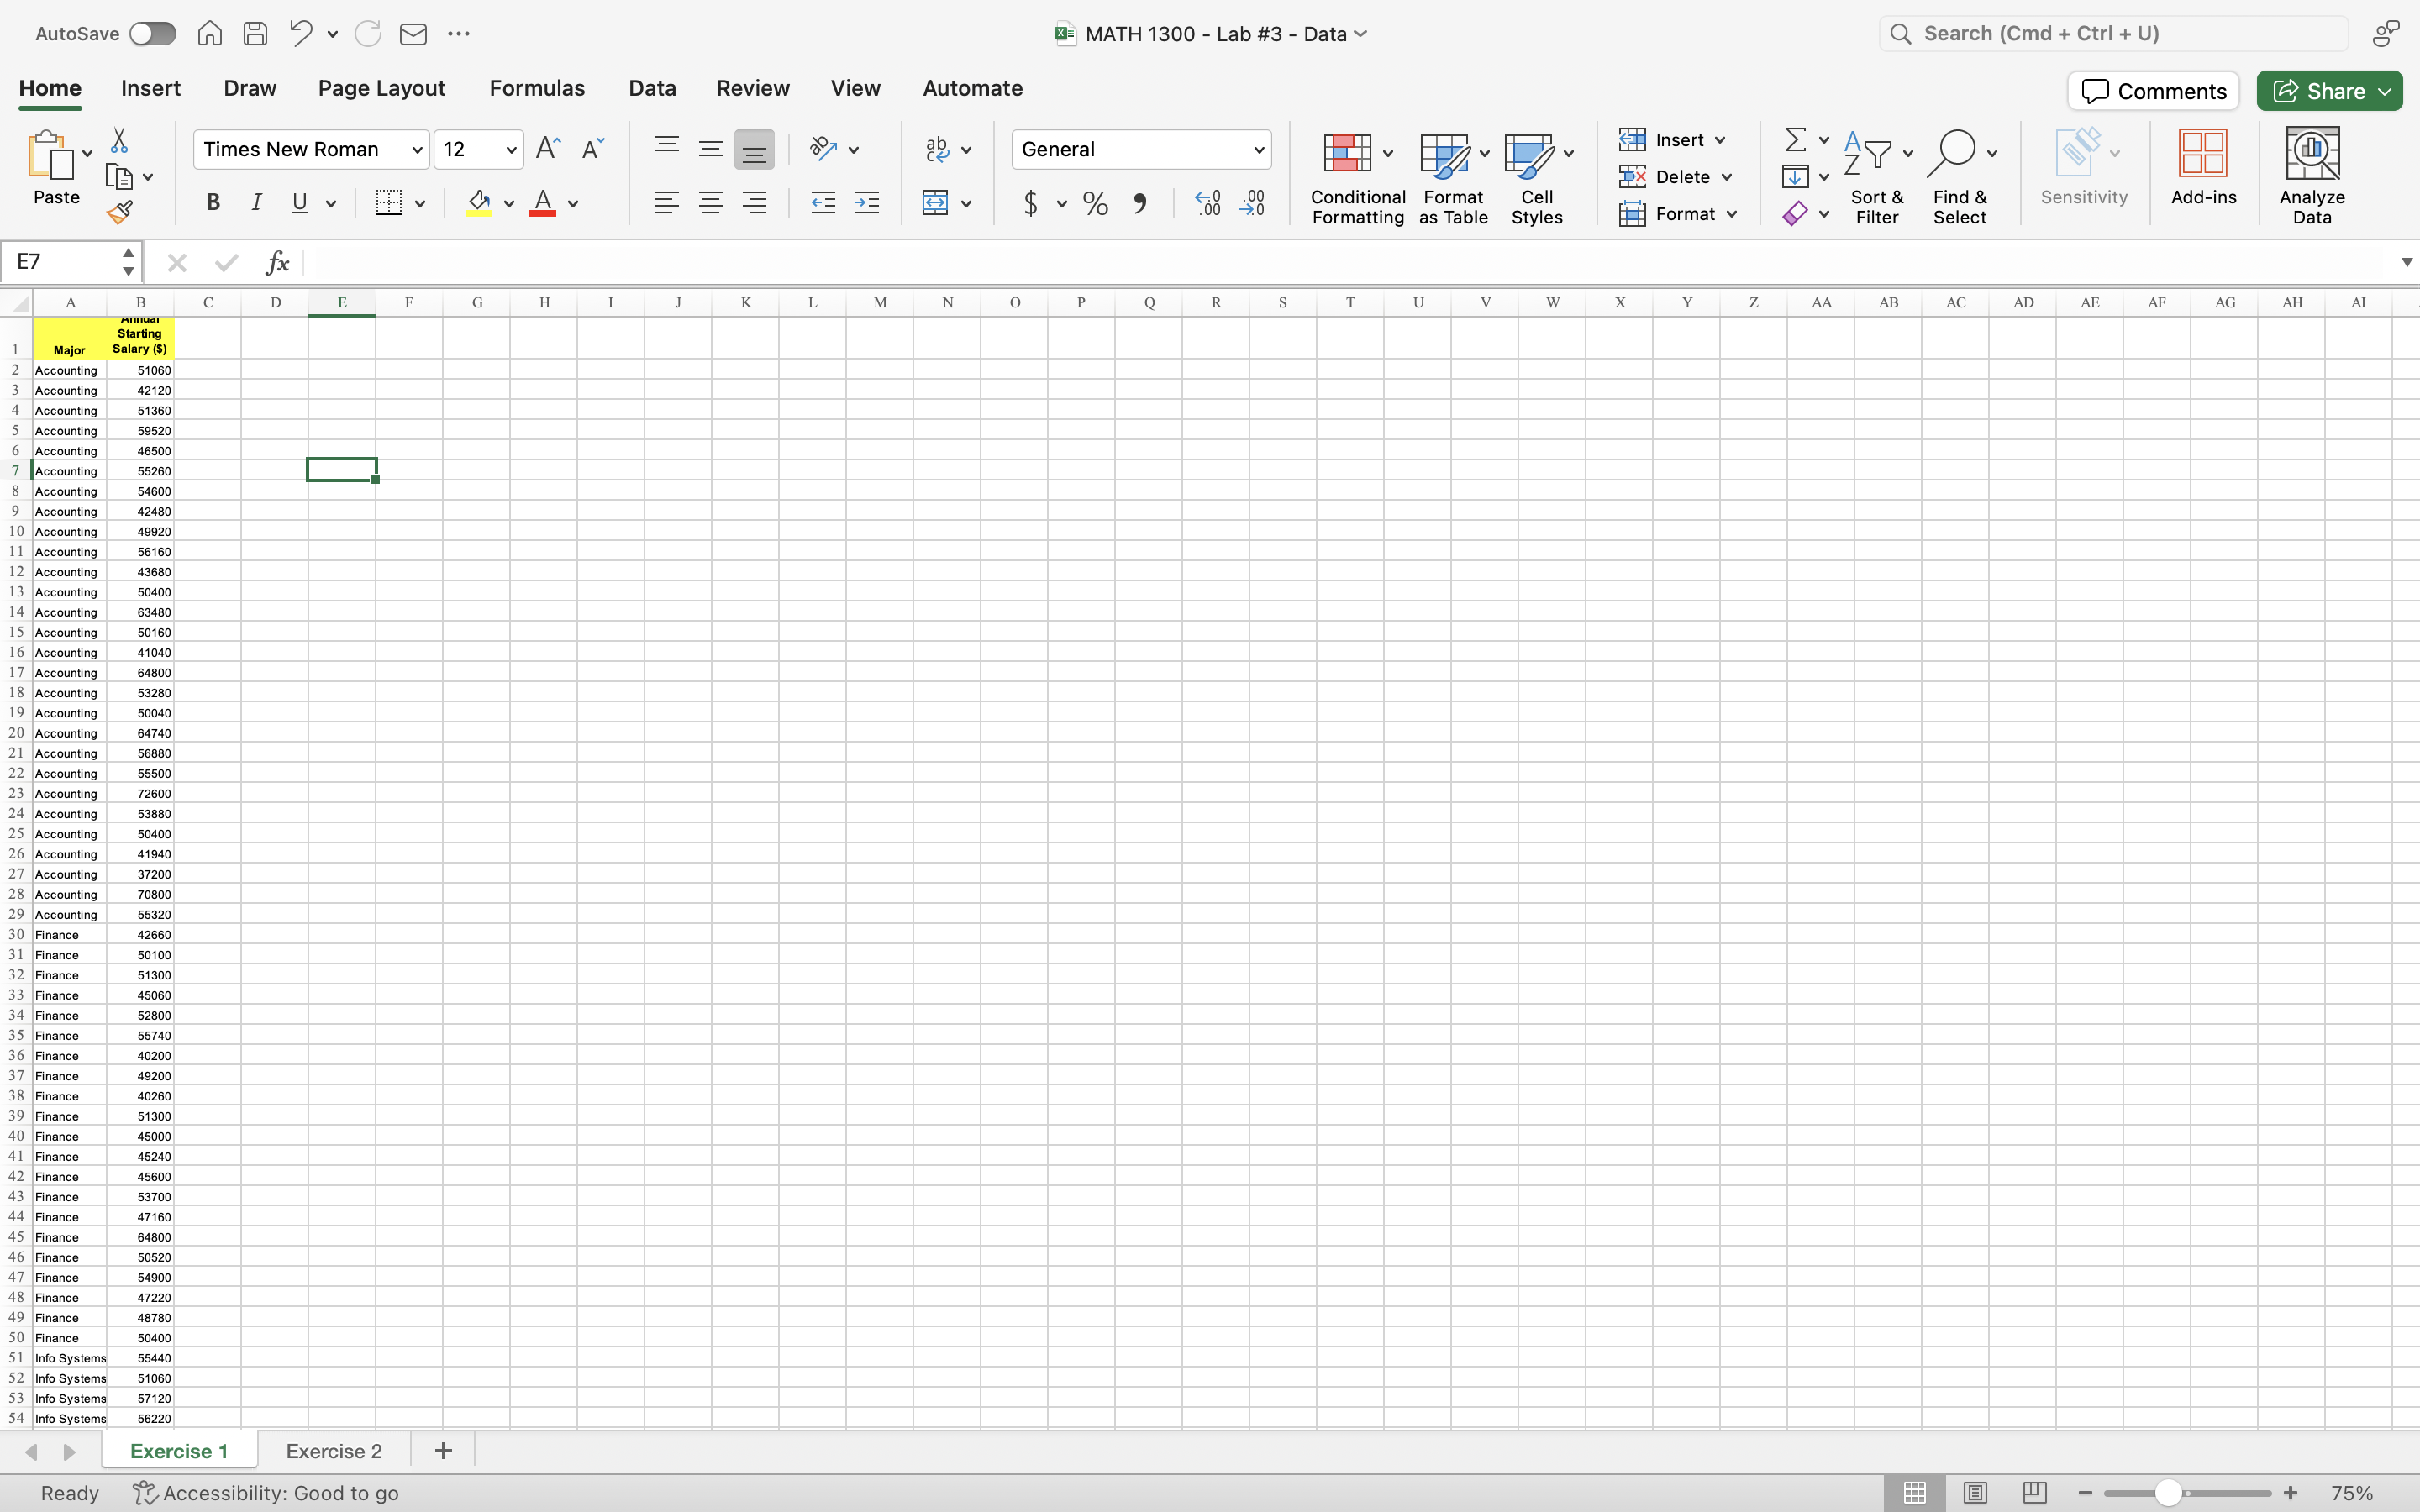
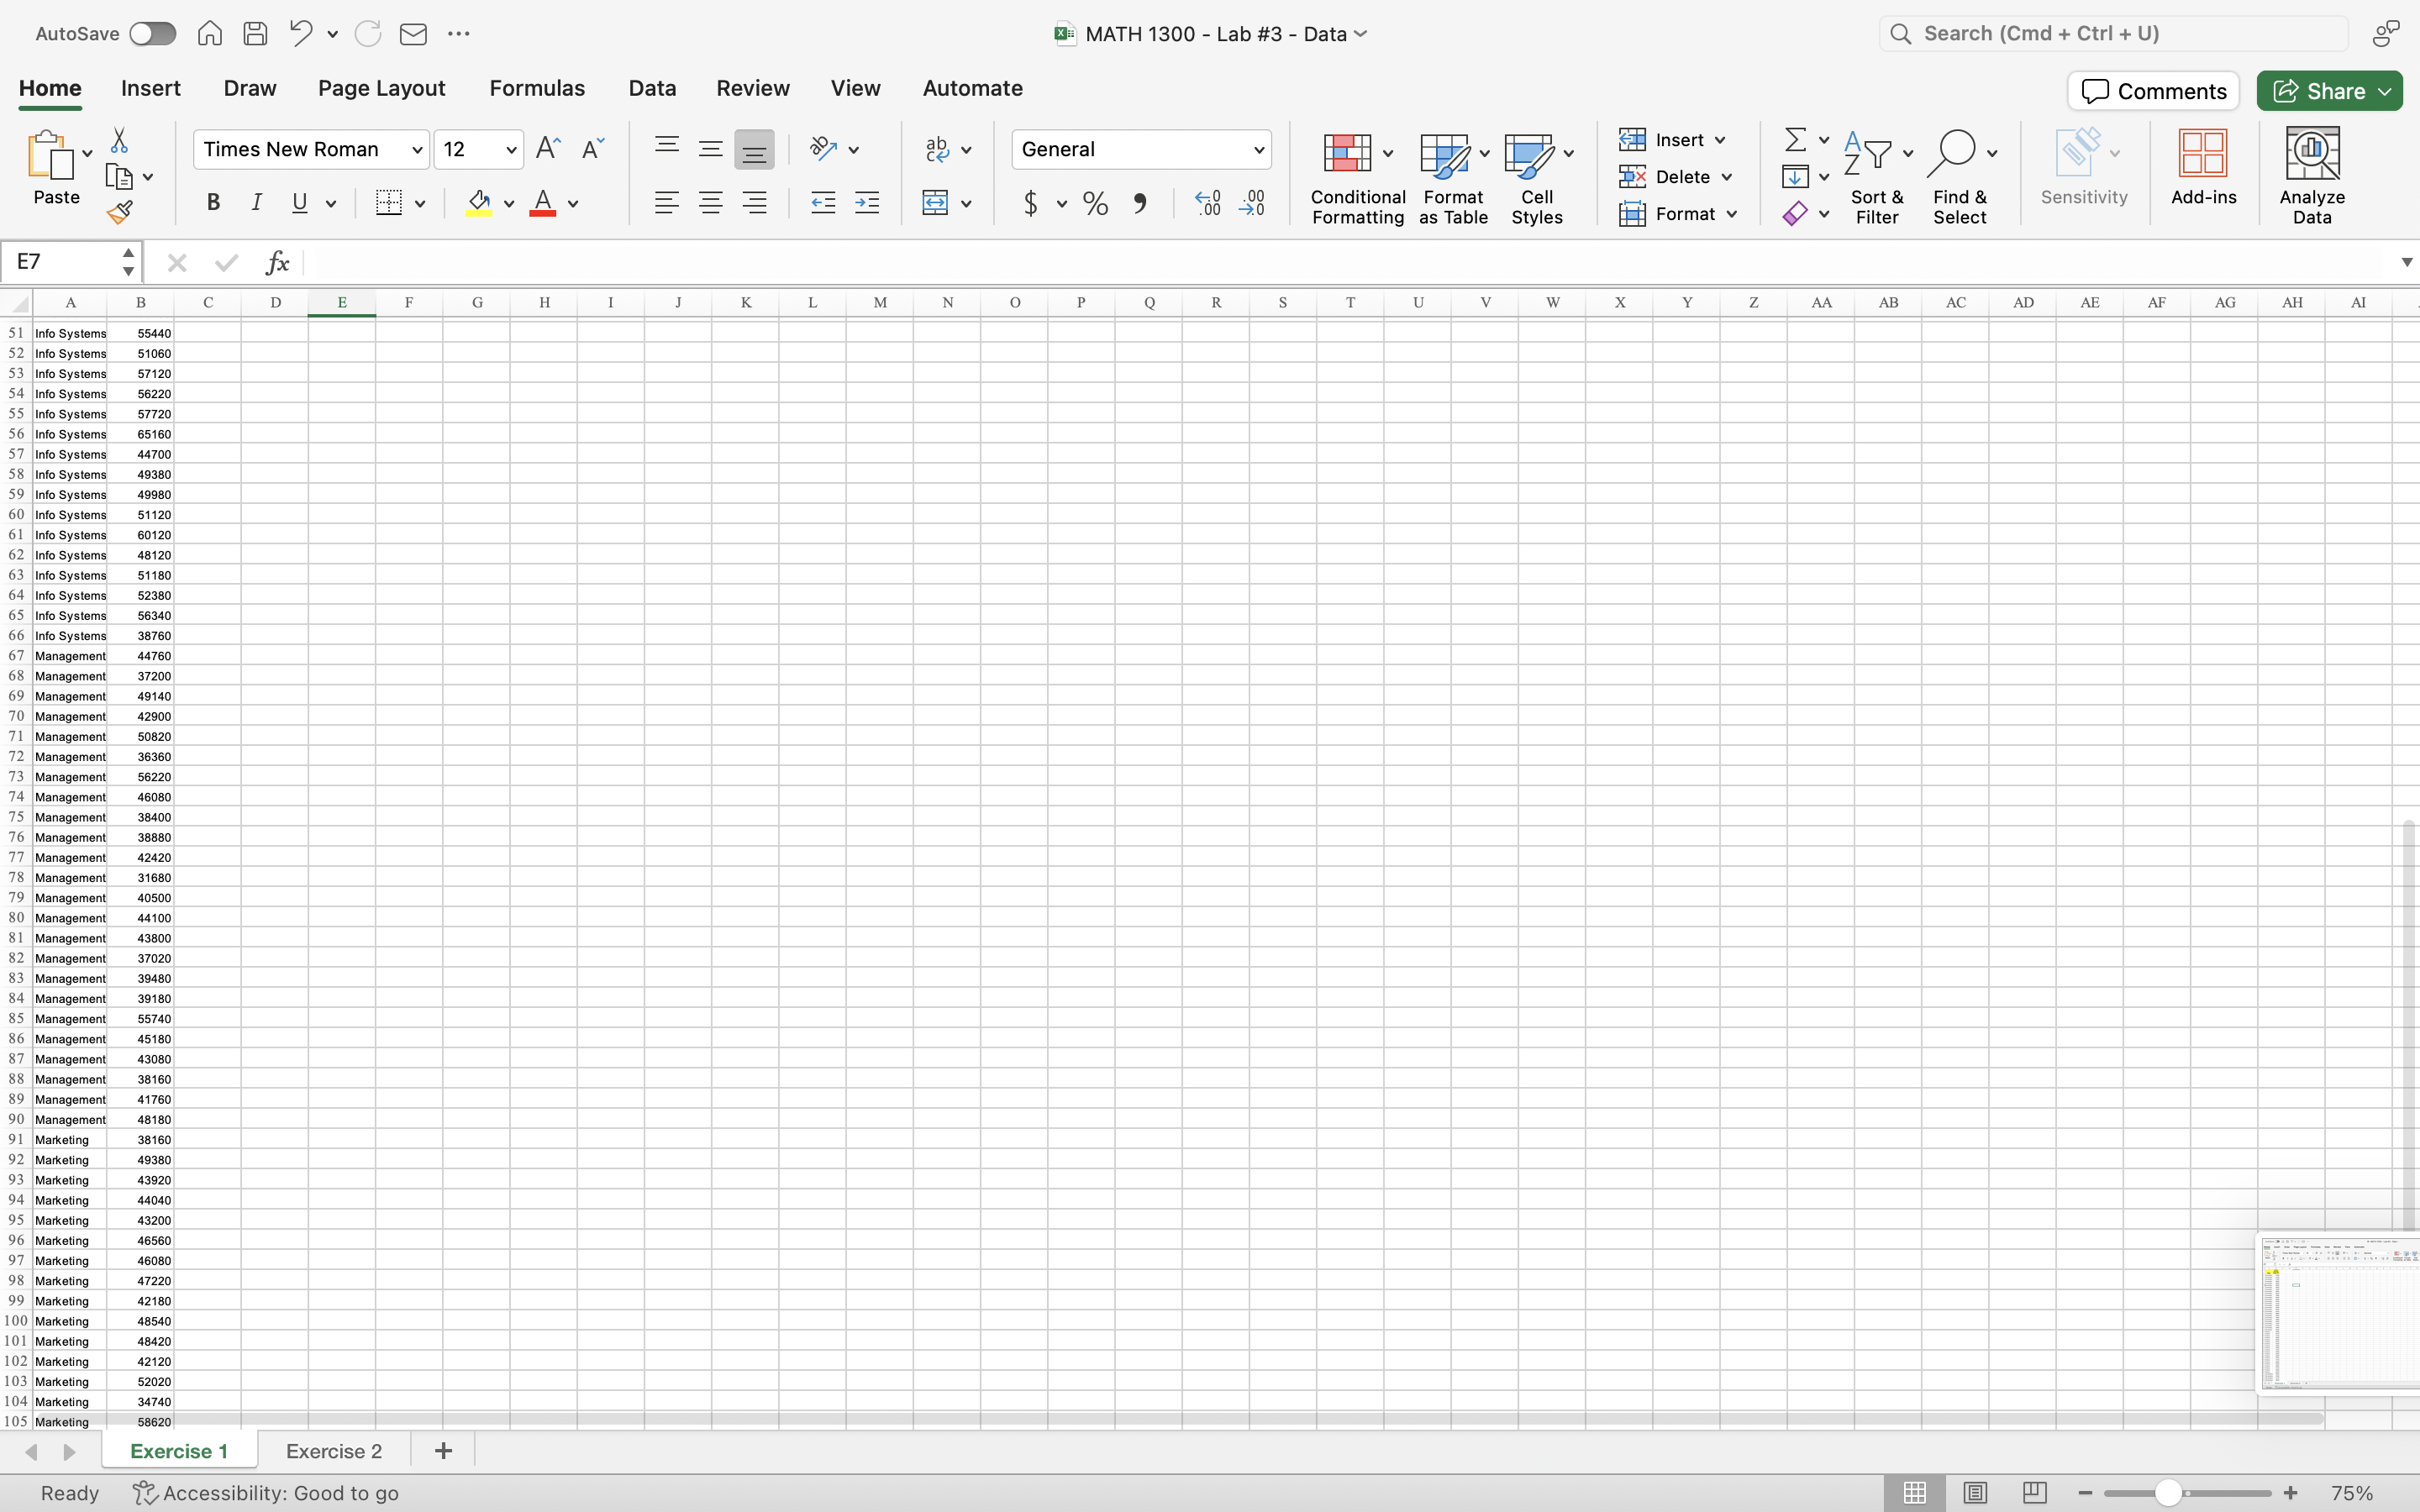
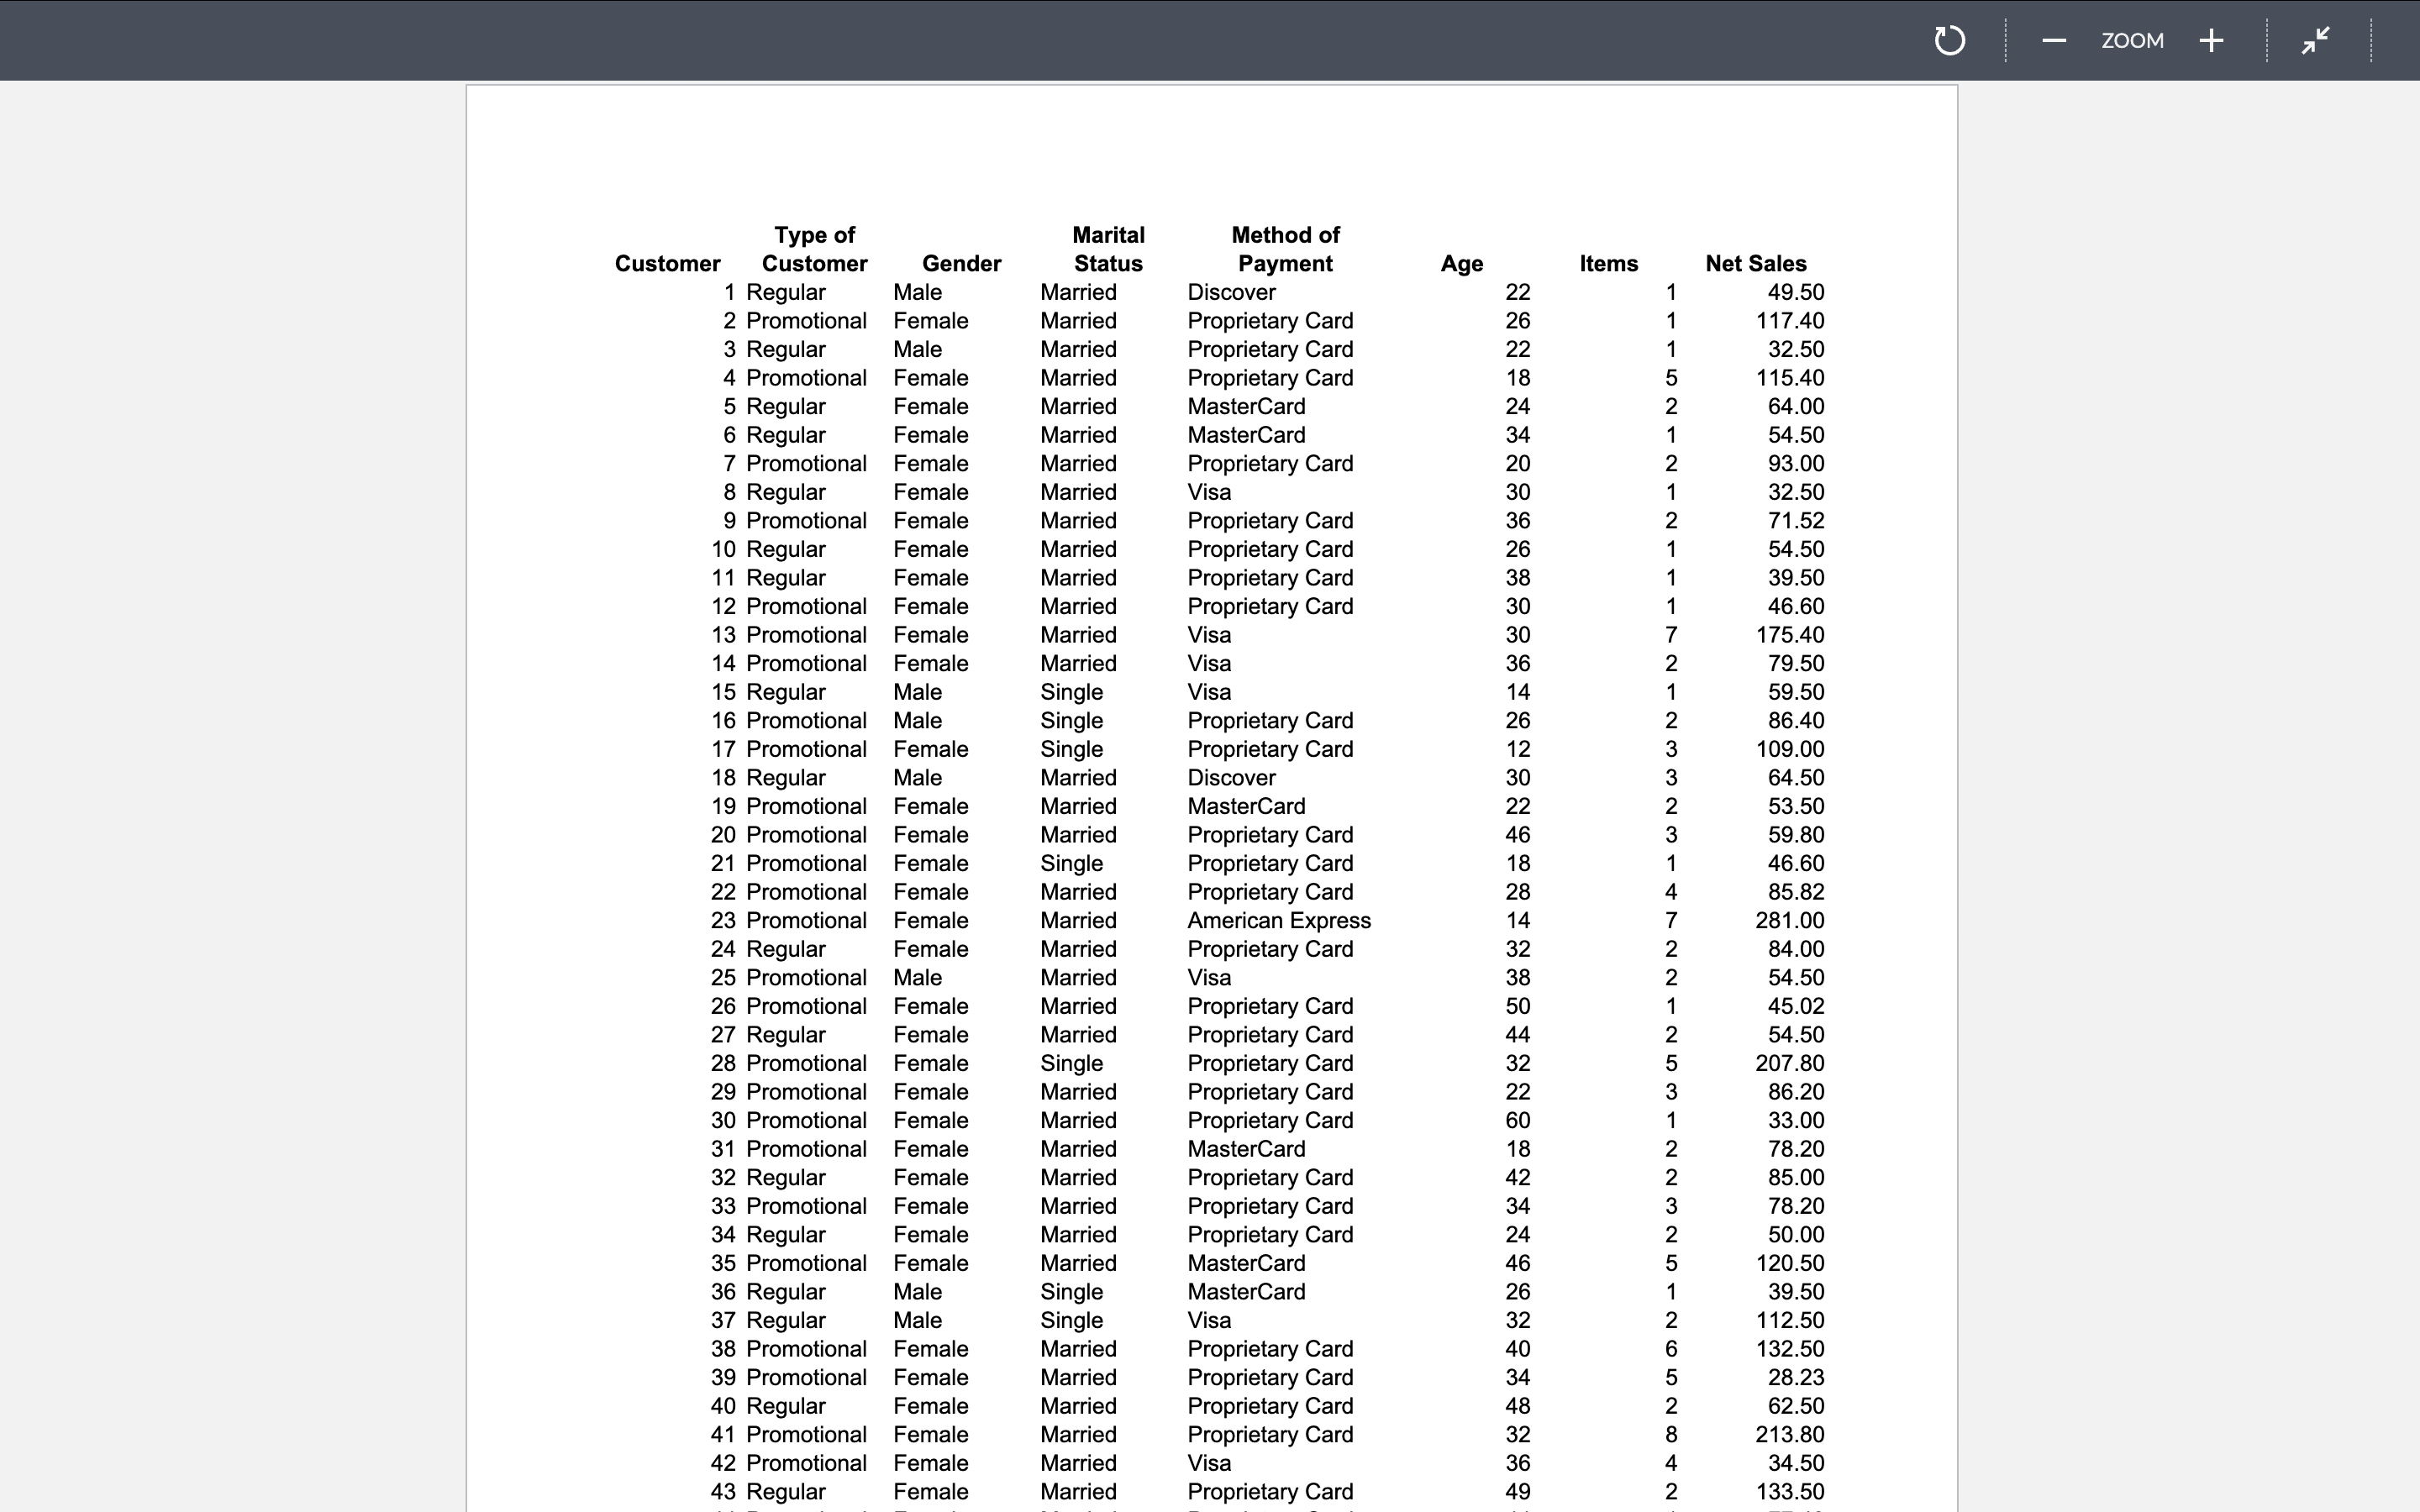
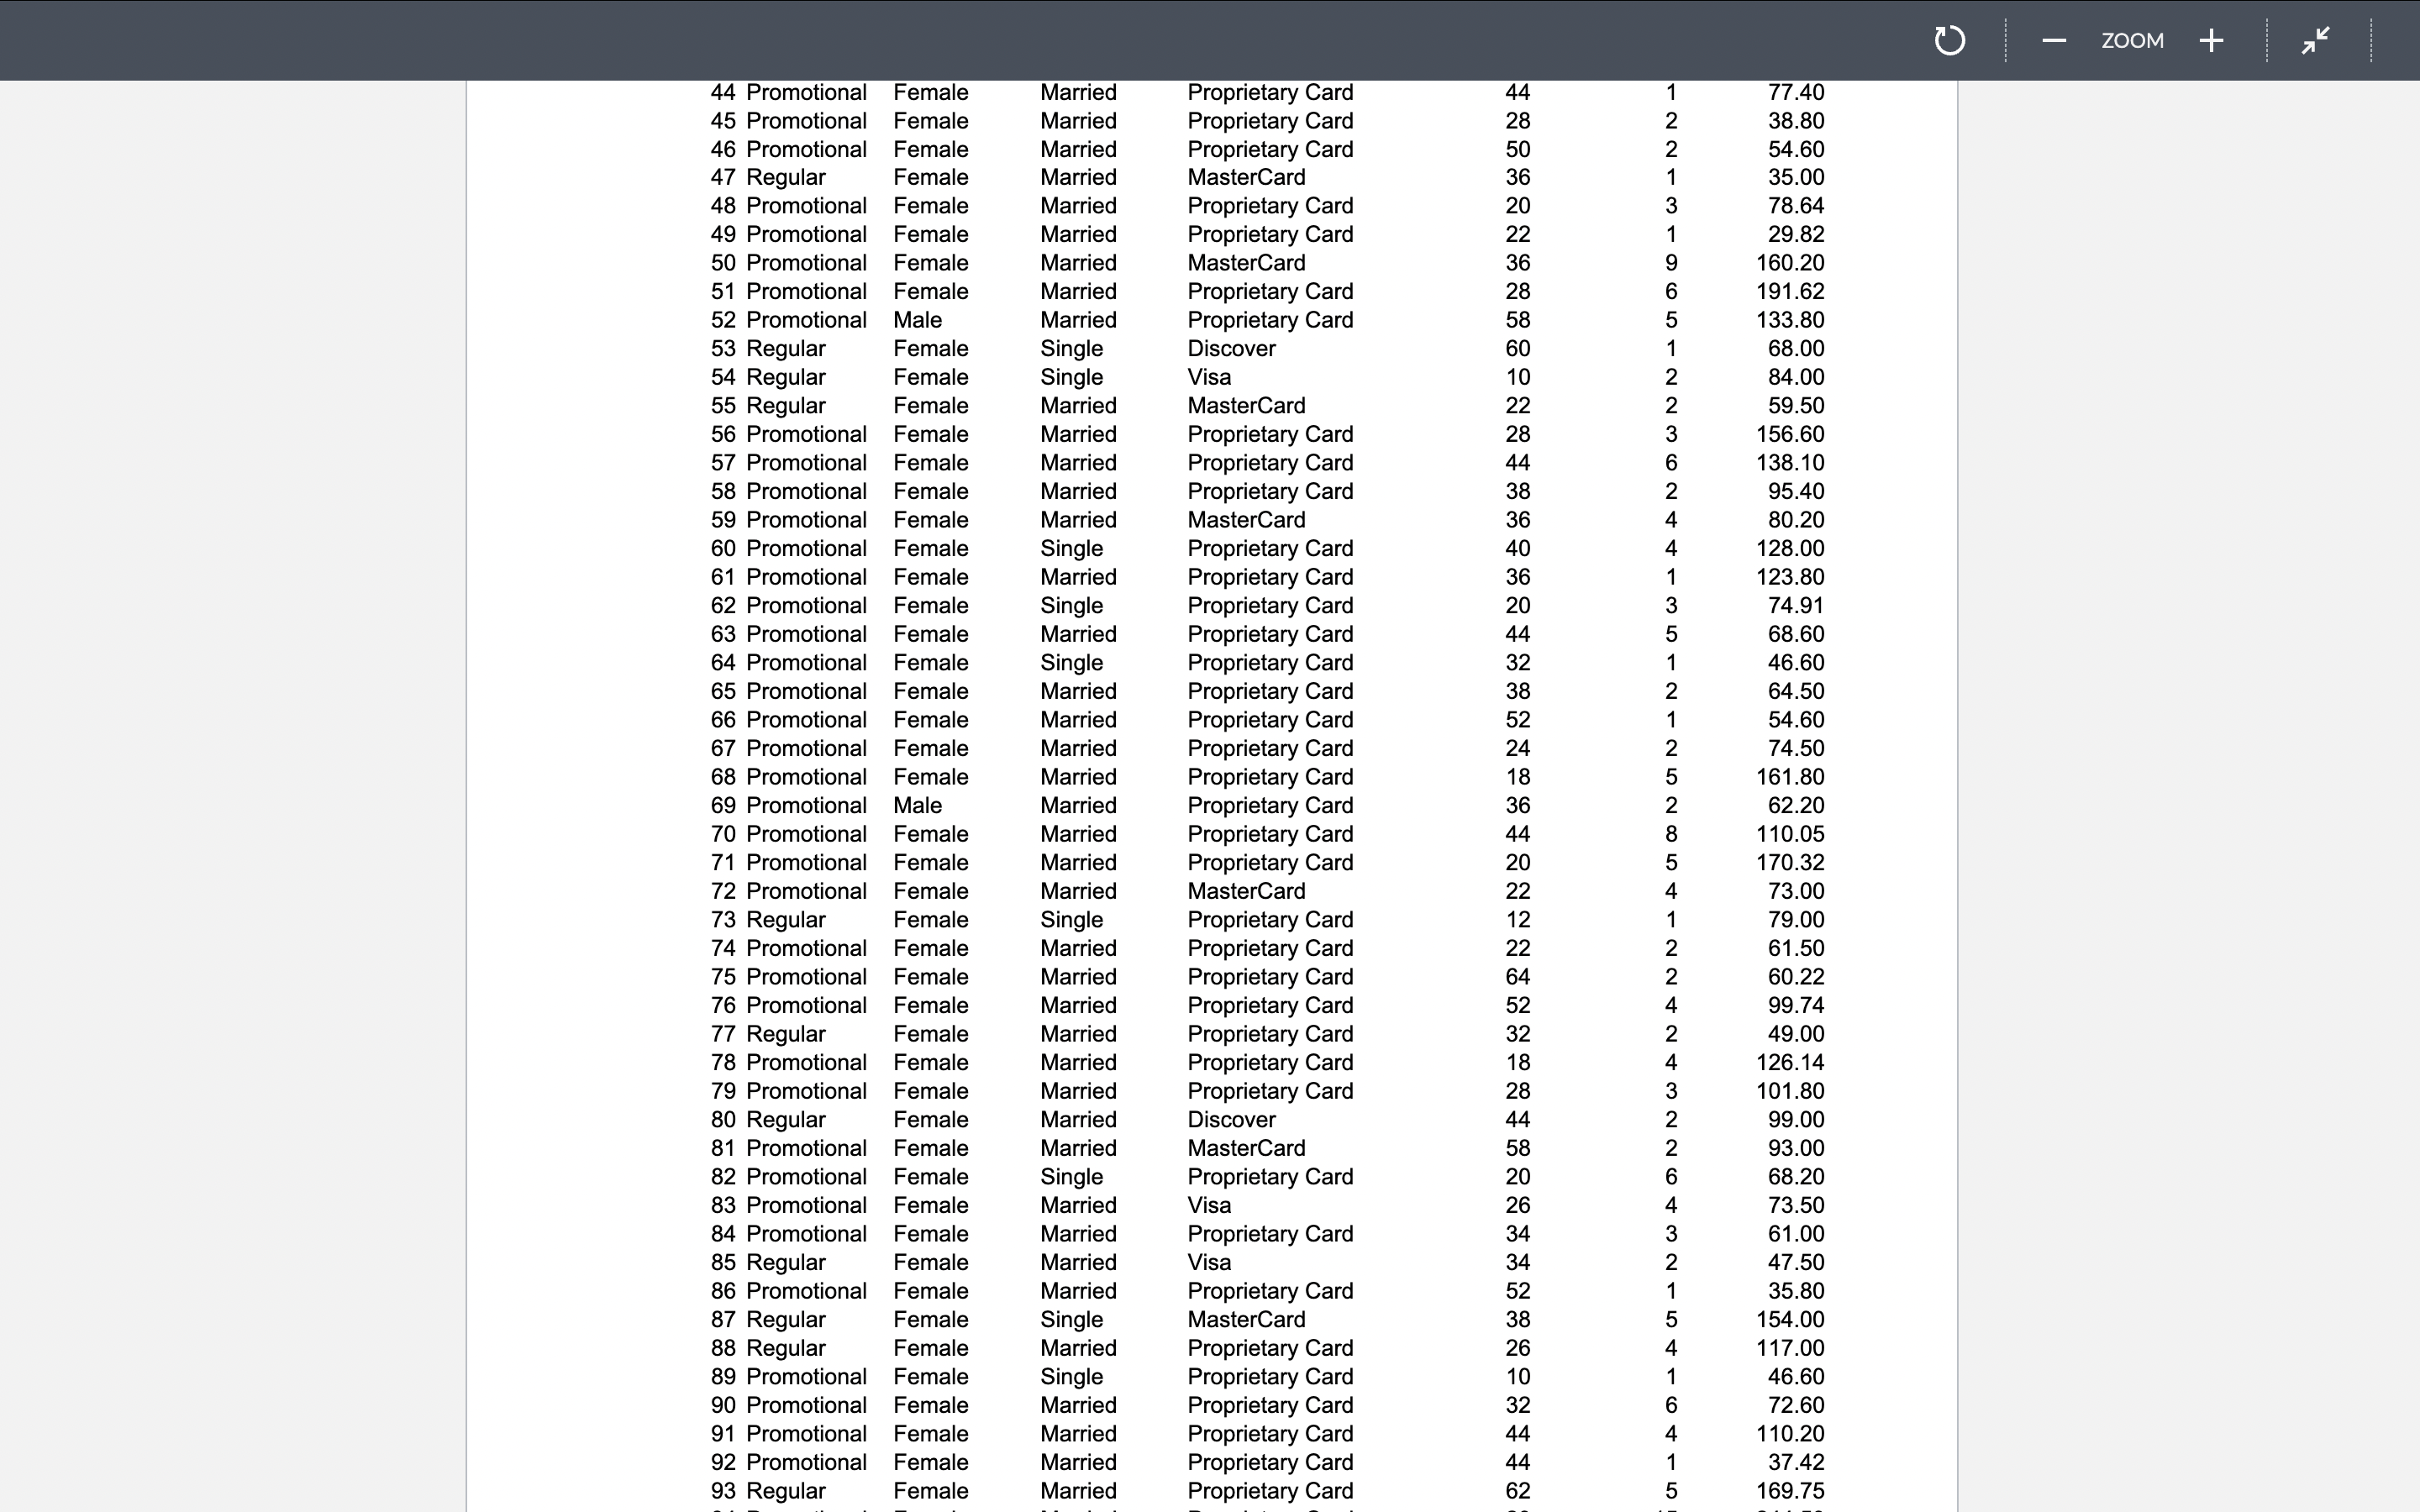
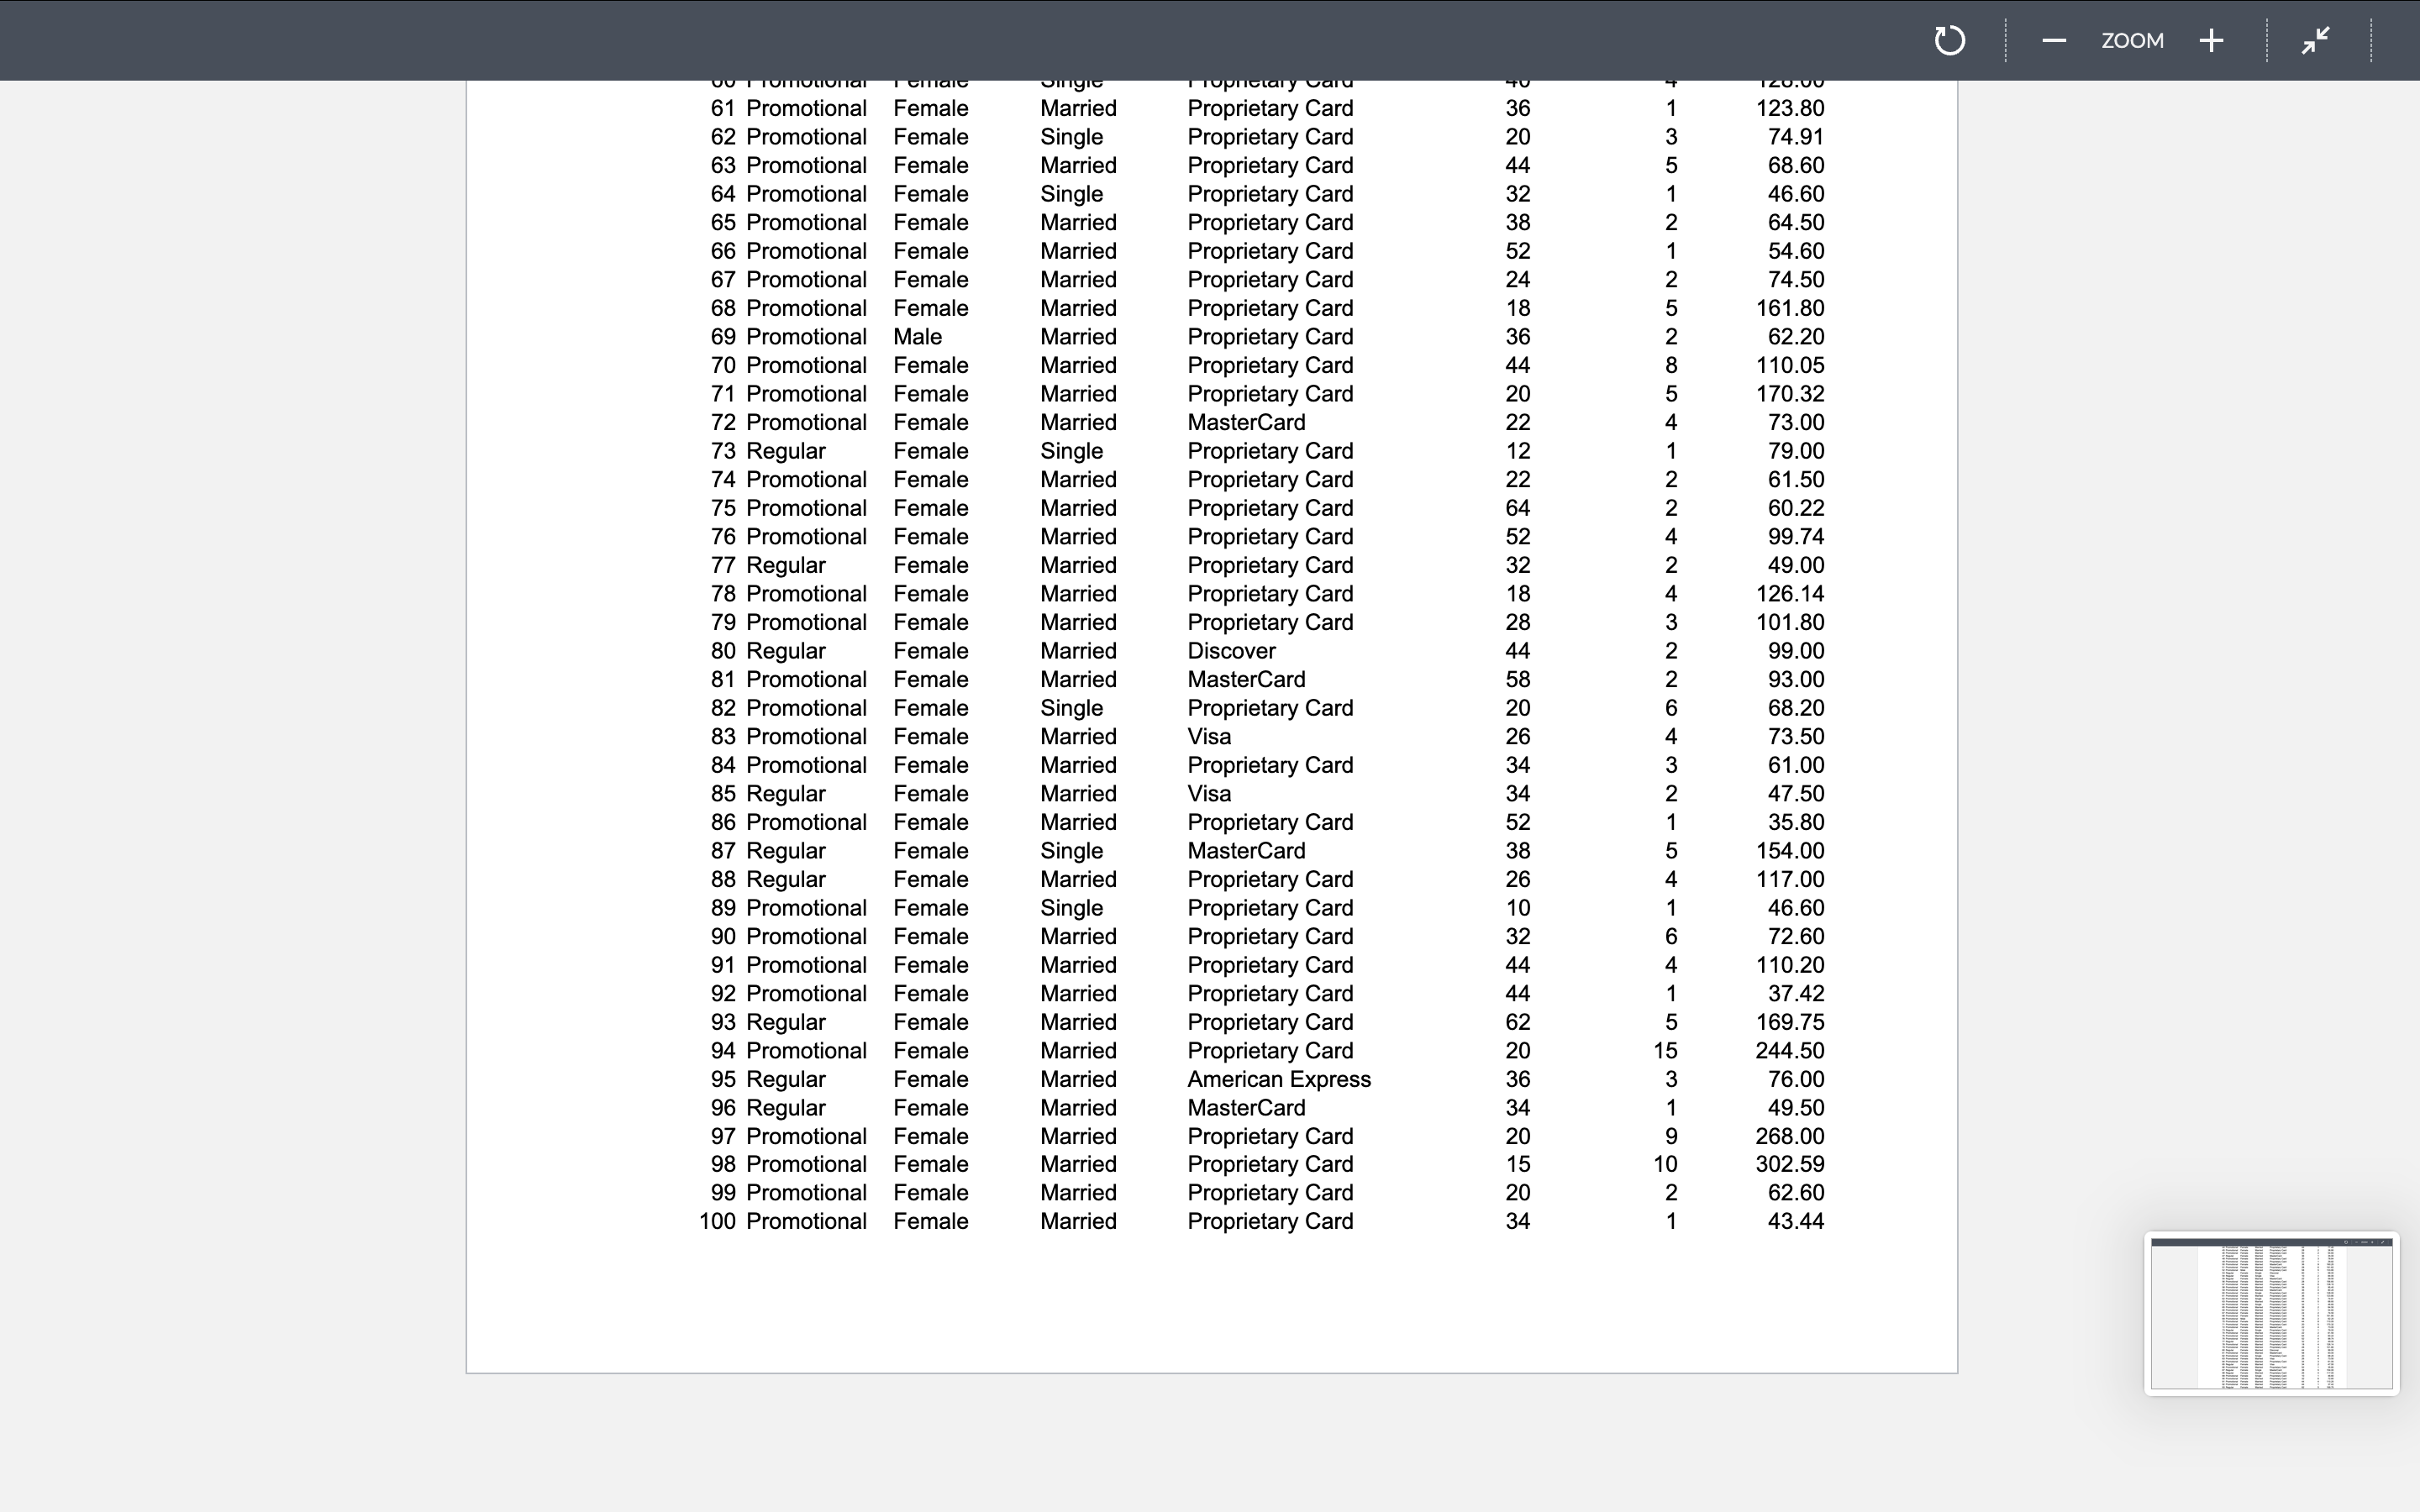
View 125% v Zoom e= @ mm QO Gl o Insert Table Chart Text Shape Media Share Name(s): Date: Lab #3 Measures of Position, Correlation & Regression Objectives: At the end of this lab, you will be able to: Find quartiles and percentiles using MS Excel and compare them Construct and describe box-and-whisker plots Identify outliers and describe their implications Construct side-by-side (comparative) box-and-whisker plots to compare distributions Construct scatter plots using MS Excel Identify the presence of linear relationships and describe in the context of the problem. Find simple linear regression models for business applications and make estimates. Interpret the slope and y-intercept in the context of the problem * Interpret the results in the context of the problem Exercise 1. Refer to the Excel file Lab #3 to complete the following tasks. All results and explanations need to be reported within this Word document after each question. Your results should be formatted and edited. Make sure to use complete sentences when explaining your results. You need to submit a hard copy of your lab. Excel Functions: Finding Quartiles and Percentiles: To find quartiles such as the first quartile, Q1, enter =quartile(array, 1). To find percentiles such as the 25th percentile, Pos, enter =percentile(array, 0.25). Box-and-whisker plots can be used to provide a graphical summary of a single variable as well as two or more groups to facilitate visual comparisons among them. For example, suppose the Financial Services office decides to conduct a follow-up study to compare annual starting salaries by the graduate's major: marketing, management, information systems, finance, and account majors. The major and starting salary data for a sample of 111 business school graduates in 2012 are shown in Excel file Lab #3. A. Construct a frequency distribution and graph showing the number of graduates by each major. B. Find the five-number summary for the starting salary data of a sample of 111 business graduates in 2012. Round the results to the nearest dollar. & 8 Format Document Nothing selected. Select an object or text to format. J View 125% v Zoom o= @ mm QO Gl o Insert Table Chart Text Shape Media Share copy of your lab. Excel Functions: Finding Quartiles and Percentiles: To find quartiles such as the first quartile, Q1, enter =quartile(array, 1). To find percentiles such as the 25th percentile, Pos, enter =percentile(array, 0.25). Box-and-whisker plots can be used to provide a graphical summary of a single variable as well as two or more groups to facilitate visual comparisons among them. For example, suppose the Financial Services office decides to conduct a follow-up study to compare annual starting salaries by the graduate's major: marketing, management, information systems, finance, and account majors. The major and starting salary data for a sample of 111 business school graduates in 2012 are shown in Excel file Lab #3. A. Construct a frequency distribution and graph showing the number of graduates by each major. B. Find the five-number summary for the starting salary data of a sample of 111 business graduates in 2012. Round the results to the nearest dollar. C. Find the 25th, 50th, 75th percentiles for the data and round them to the nearest dollar. Compare the percentiles to the quartiles respectively. Are the values different? 1 D. Construct a box-and-whisker plot for the data. Describe the shape of the distribution. E. Select two majors (for example marketing and management). Find the mean, standard deviation, and five-number summary for the starting salaries by each major you selected. Round the results to the nearest dollar. Interpret your results in the context of problem. F. Find the interquartile range, lower and upper inner fences for the annual starting salaries by each major you selected in Part E. Determine whether there are outliers for the annual starting salaries by each major. If so, what does this imply? G. Construct a side-by-side (comparative) box-and-whisker plot for the annual starting salaries by each major you selected in Part E. Describe each distribution. Format the vertical axes and your graph appropriately. & 8 Format Document Nothing selected. Select an object or text to format. 125% v + A 19 View Zoom Add Page Insert Table Chart Text Shape Media Comment Share Format Document G. Construct a side-by-side (comparative) box-and-whisker plot for the annual starting salaries by each major you selected in Part E. Describe each distribution. Format the vertical axes and your graph appropriately. H. Interpret the side-by-side (comparative) box-and-whisker plot using the five-number summary you constructed in Part G. Compare and discuss the typical annual starting salaries for each major. What conclusions can be drawn? Exercise 2. Refer to the Excel file Lab #3 to complete the following tasks. All results and explanations need to be reported within this Word document after each question. Your results should be formatted and edited. Make sure to use complete sentences when explaining your results. You need to submit a hard copy of your lab. Excel Functions: Under the Data Analysis menu, you will find the Correlation and the Regression functions. A. Create a scatterplot for the pair variable with the largest correlation coefficient. What is the relationship between the correlation coefficient and your scatter plot' B. Identify the pair of variables that have the highest correlation coefficient? What does this mean? Nothing selected. C. Create a scatterplot for the paired variables with the highest correlation coefficient you found in Select an object or text to format. Part B. What is the relationship between the correlation coefficient and your scatterplot? D. Find the simple linear regression model for the paired variables with the highest correlation coefficient. (First, identifying which variable is the dependent and independent variable.) Explain your reasoning E. Interpret the slope and the y-intercept in the context of the problem. N 20 Exercise 3. Open your group project data and guidelines. Collaborate with your project partners and thet 125% v = e@ @ G Gal o & 8 View Zoom Insert Table Chart Text Shape Media Share Format Document Exercise 3. Open your group project data and guidelines. Collaborate with your project partners and produce the Excel outputs for the first analysis listed on the project guidelines below. (You do not have to interpret the outputs yet.) Read and follow the instructions carefully. The Excel outputs such as tables, graphs, summary statistics produced by using Excel. All statistics should not have more than 2 decimal places. All Excel outputs (such as graphs and summary statistics) f each related analysis must be fitted in one sheet. 4. Construct a COMPARATIVE (also known as SIDE-BY-SIDE) box-and-whisker plot and find the summary statistics (including the quartiles) for net sales by each type of customer (regular/ promotion). Make sure that you format the x-axes on each plot and compare the plots using the same scale. Describe the shape of the distribution for each type of customer, and compare the graphs by interpreting the summary statistics, particularly the five- number summary. What can you conclude? Nothing selected. Select an object or text to format. Hint: ACOMPARATIVE (SIDE-BY-SIDE) box-and-whisker plot is constructed by placing singl boxplots adjacent to one another on a single scale. 5. Develop a scatterplot and explore the correlation between customer age and net sales by each type of customer (regular/promotion). Use the horizontal axis for the customer age to graph. Find the linear regression line that models the data by each type of customer. Round the rate of changes (slopes) to two decimal places and interpret them in terms of the relation between the change in age and the change in net sales. What can you conclude? Hint: Rate of Change = Vertical Change / Horizontal Change = Change in y / Change in x AutoSave O A A 5 . CO ... X: MATH 1300 - Lab #3 - Data Q Search (Cmd + Ctrl + U) Home Insert Draw Page Layout Formulas Data Review View Automate Comments Share Times New Roman v 12 AA ab v General Insert v Ex Delete v Paste IUVV DV Av E $ ~ % " Conditional Format Cell Sort & Find & Sensitivity Add-ins Analyze Formatting as Table Styles Format v v Filter Select Data F7 fx B C D E F G H I K L M N P Q R S T U V W X Y Z AA AB AC AD AE AF AG AH AI Annual starting Major Salary ($) Accounting 51060 3 A Accounting 42120 Accounting 51360 Accounting 59520 Accounting 46500 Accounting 55260 Accounting 54600 Accounting 42480 10 Accounting 49920 1 1 Accounting 56160 12 Accounting 43680 13 Accounting 50400 14 Accounting 63480 15 Accounting 50160 16 Accounting 41040 17 Accounting 64800 18 Accounting 53280 19 Accounting 50040 20 Accounting 64740 21 Accounting 56880 22 Accounting 55500 23 Accounting 72600 24 Accounting 53880 25 Accounting 50400 26 Accounting 41940 27 Accounting 37200 28 Accounting 70800 29 Accounting 55320 30 Finance 42660 31 Finance 50100 32 Finance 51300 33 Finance 45060 34 Finance 52800 35 Finance 55740 36 Finance 40200 37 Finance 49200 38 Finance 40260 39 Finance 51300 40 Finance 45000 41 Finance 45240 42 Finance 45600 43 Finance 53700 44 Finance 47160 +5 Finance 64800 46 Finance 50520 47 Finance 54900 48 Finance 47220 49 Finance 48780 50 Finance 50400 51 Info Systems 55440 2 Info Systems 51060 53 Info Systems 57120 54 Info Systems 56220 Exercise 1 Exercise 2 + Ready Accessibility: Good to go + 75%AutoSave O A A 5 . CO ... X: MATH 1300 - Lab #3 - Data Q Search (Cmd + Ctrl + U) Home Insert Draw Page Layout Formulas Data Review View Automate Comments Share Insert v Times New Roman v 12 AA ab v General x Delete v Paste V V A v E $ ~ % " Conditional Format Cell Sort & Find & Sensitivity Add-ins Analyze Formatting as Table Styles Format v v Filter Select Data E7 4 fx B C D E F G H I K L M N P Q R S U V W X Y Z AA AB AC AD AE AF AG AH AI 51 Info Systems 55440 52 Info Systems 51060 53 Info Systems 57120 54 Info Systems 56220 $5 Info Systems 57720 56 Info Systems 65160 57 Info Systems 44700 58 Info Systems 49380 59 Info Systems 49980 60 Info Systems 51120 61 Info Systems 60120 62 Info Systems 48120 63 Info Systems OOL LG 64 Info Systems 52380 65 Info Systems 56340 66 Info Systems 38760 67 Management 44760 68 Management 37200 69 Management 49140 70 Management 42900 71 Management 50820 72 Management 36360 73 Management 56220 74 Management 46080 75 Management 38400 76 Management 38880 77 Management 42420 78 Management 31680 79 Management 40500 80 Management 44100 81 Management 43800 82 Management 37020 83 Management 39480 84 Management 39180 85 Management 55740 86 Management 45180 87 Management 43080 88 Management 38160 89 Management 41760 90 Management 48180 91 Marketing 38160 92 Marketing 49380 93 Marketing 43920 94 Marketing 44040 95 Marketing 43200 96 Marketing 46560 97 Marketing 46080 98 Marketing 47220 99 Marketing 42180 100 Marketing 48540 101 Marketing 48420 102 Marketing 42120 103 Marketing 52020 104 Marketing 34740 105 Marketing 58620 Exercise 1 Exercise 2 + + 75% Ready Accessibility: Good to goType of Customer Customer 1 Regular 2 Promotional 3 Regular 4 Promotional 5 Regular 6 Regular 7 Promotional 8 Regular 9 Promotional 10 Regular 11 Regular 12 Promotional 13 Promotional 14 Promotional 15 Regular 16 Promotional 17 Promotional 18 Regular 19 Promotional 20 Promotional 21 Promotional 22 Promotional 23 Promotional 24 Regular 25 Promotional 26 Promotional 27 Regular 28 Promotional 29 Promotional 30 Promotional 31 Promotional 32 Regular 33 Promotional 34 Regular 35 Promotional 36 Regular 37 Regular 38 Promotional 39 Promotional 40 Regular 41 Promotional 42 Promotional 43 Regular Gender Male Female Male Female Female Female Female Female Female Female Female Female Female Female Male Male Female Male Female Female Female Female Female Female Male Female Female Female Female Female Female Female Female Female Female Male Male Female Female Female Female Female Female Marital Status Married Married Married Married Married Married Married Married Married Married Married Married Married Married Single Single Single Married Married Married Single Married Married Married Married Married Married Single Married Married Married Married Married Married Married Single Single Married Married Married Married Married Married Method of Payment Discover Proprietary Card Proprietary Card Proprietary Card MasterCard MasterCard Proprietary Card Visa Proprietary Card Proprietary Card Proprietary Card Proprietary Card Visa Visa Visa Proprietary Card Proprietary Card Discover MasterCard Proprietary Card Proprietary Card Proprietary Card American Express Proprietary Card Visa Proprietary Card Proprietary Card Proprietary Card Proprietary Card Proprietary Card MasterCard Proprietary Card Proprietary Card Proprietary Card MasterCard MasterCard Visa Proprietary Card Proprietary Card Proprietary Card Proprietary Card Visa Proprietary Card Age 22 26 22 18 24 20 30 36 26 38 30 36 14 26 12 30 22 46 18 28 14 32 38 50 32 22 18 42 24 46 26 32 40 48 32 36 49 Items NPONMANAGTNWNNAWANANNNAAWNWWNANNAAANANANGAAA= Net Sales 49.50 117.40 32.50 115.40 64.00 54.50 93.00 32.50 71.52 54.50 39.50 46.60 175.40 79.50 59.50 86.40 109.00 64.50 53.50 59.80 46.60 85.82 281.00 84.00 54.50 45.02 54.50 207.80 86.20 33.00 78.20 85.00 78.20 50.00 120.50 39.50 112.50 132.50 28.23 62.50 213.80 34.50 133.50 44 Promotional 45 Promotional 46 Promotional 47 Regular 48 Promotional 49 Promotional 50 Promotional 51 Promotional 52 Promotional 53 Regular 54 Regular 55 Regular 56 Promotional 57 Promotional 58 Promotional 59 Promotional 60 Promotional 61 Promotional 62 Promotional 63 Promotional 64 Promotional 65 Promotional 66 Promotional 67 Promotional 68 Promotional 69 Promotional 70 Promotional 71 Promotional 72 Promotional 73 Regular 74 Promotional 75 Promotional 76 Promotional 77 Regular 78 Promotional 79 Promotional 80 Regular 81 Promotional 82 Promotional 83 Promotional 84 Promotional 85 Regular 86 Promotional 87 Regular 88 Regular 89 Promotional 90 Promotional 91 Promotional 92 Promotional 93 Regular Female Female Female Female Female Female Female Female Male Female Female Female Female Female Female Female Female Female Female Female Female Female Female Female Female Male Female Female Female Female Female Female Female Female Female Female Female Female Female Female Female Female Female Female Female Female Female Female Female Female Married Married Married Married Married Married Married Married Married Single Single Married Married Married Married Married Single Married Single Married Single Married Married Married Married Married Married Married Married Single Married Married Married Married Married Married Married Married Single Married Married Married Married Single Married Single Married Married Married Married Proprietary Card Proprietary Card Proprietary Card MasterCard Proprietary Card Proprietary Card MasterCard Proprietary Card Proprietary Card Discover Visa MasterCard Proprietary Card Proprietary Card Proprietary Card MasterCard Proprietary Card Proprietary Card Proprietary Card Proprietary Card Proprietary Card Proprietary Card Proprietary Card Proprietary Card Proprietary Card Proprietary Card Proprietary Card Proprietary Card MasterCard Proprietary Card Proprietary Card Proprietary Card Proprietary Card Proprietary Card Proprietary Card Proprietary Card Discover MasterCard Proprietary Card Visa Proprietary Card Visa Proprietary Card MasterCard Proprietary Card Proprietary Card Proprietary Card Proprietary Card Proprietary Card Proprietary Card 28 50 36 20 22 36 28 58 60 10 22 28 44 38 40 36 20 32 38 52 24 18 36 20 22 12 22 52 32 18 28 58 20 26 52 38 26 10 32 44 62 IM ARALAATANWARANNWANANNAARATANANANATWOARANDWNNATHOAWANN= 77.40 38.80 54.60 35.00 78.64 29.82 160.20 191.62 133.80 68.00 84.00 59.50 156.60 138.10 95.40 80.20 128.00 123.80 74.91 68.60 46.60 64.50 54.60 74.50 161.80 62.20 110.05 170.32 73.00 79.00 61.50 60.22 99.74 49.00 126.14 101.80 99.00 93.00 68.20 73.50 61.00 47.50 35.80 154.00 117.00 46.60 72.60 110.20 37.42 169.75 61 Promotional 62 Promotional 63 Promotional 64 Promotional 65 Promotional 66 Promotional 67 Promotional 68 Promotional 69 Promotional 70 Promotional 71 Promotional 72 Promotional 73 Regular 74 Promotional 75 Promotional 76 Promotional 77 Regular 78 Promotional 79 Promotional 80 Regular 81 Promotional 82 Promotional 83 Promotional 84 Promotional 85 Regular 86 Promotional 87 Regular 88 Regular 89 Promotional 90 Promotional 91 Promotional 92 Promotional 93 Regular 94 Promotional 95 Regular 96 Regular 97 Promotional 98 Promotional 99 Promotional 100 Promotional Female Female Female Female Female Female Female Female Male Female Female Female Female Female Female Female Female Female Female Female Female Female Female Female Female Female Female Female Female Female Female Female Female Female Female Female Female Female Female Female Married Single Married Single Married Married Married Married Married Married Married Married Single Married Married Married Married Married Married Married Married Single Married Married Married Married Single Married Single Married Married Married Married Married Married Married Married Married Married Married Proprietary Card Proprietary Card Proprietary Card Proprietary Card Proprietary Card Proprietary Card Proprietary Card Proprietary Card Proprietary Card Proprietary Card Proprietary Card MasterCard Proprietary Card Proprietary Card Proprietary Card Proprietary Card Proprietary Card Proprietary Card Proprietary Card Discover MasterCard Proprietary Card Visa Proprietary Card Visa Proprietary Card MasterCard Proprietary Card Proprietary Card Proprietary Card Proprietary Card Proprietary Card Proprietary Card Proprietary Card American Express MasterCard Proprietary Card Proprietary Card Proprietary Card Proprietary Card 36 20 32 38 52 24 18 20 22 22 52 32 18 28 58 20 26 52 38 26 10 44 62 20 36 20 20 SPNOOAWANAAARDAARTANWAOANNWANANNAATONANANAGDwW= |
Step by Step Solution
There are 3 Steps involved in it
1 Expert Approved Answer
Step: 1 Unlock
Question Has Been Solved by an Expert!
Get step-by-step solutions from verified subject matter experts
Step: 2 Unlock
Step: 3 Unlock
Students Have Also Explored These Related Mathematics Questions!