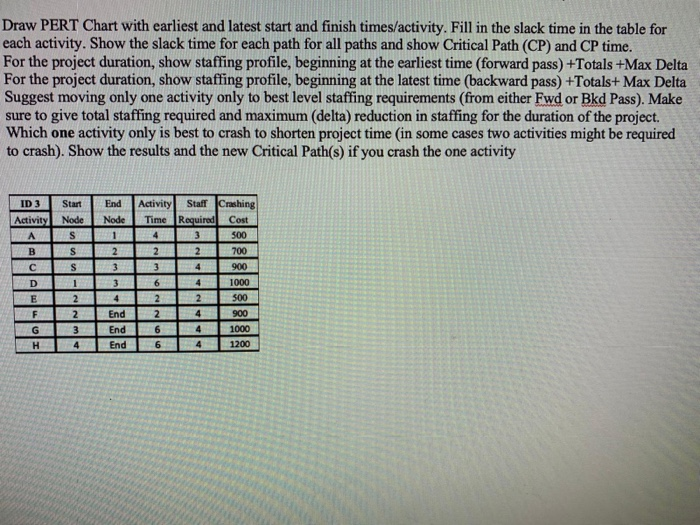
Question: Draw PERT Chart with earliest and latest start and finish times/activity. Fill in the slack time in the table for each activity. Show the slack

Draw PERT Chart with earliest and latest start
Draw PERT Chart with earliest and latest start and finish times/activity. Fill in the slack time in the table for each activity. Show the slack time for each path for all paths and show Critical Path (CP) and CP time. For the project duration, show staffing profile, beginning at the earliest time (forward pass) +Totals +Max Delta For the project duration, show staffing profile, beginning at the latest time (backward pass) +Totals+ Max Delta Suggest moving only one activity only to best level staffing requirements (from either Fwd or Bkd Pass). Make sure to give total staffing required and maximum (delta) reduction in staffing for the duration of the project. Which one activity only is best to crash to shorten project time (in some cases two activities might be required to crash). Show the results and the new Critical Path(s) if you crash the one activity ID 3 Start Star End NodeNode Activity Staff Crashing Time Required Cost Activity 500 S 700 3 4 End End 6 4 1000 6

Step by Step Solution

There are 3 Steps involved in it

1 Expert Approved Answer
Step: 1 Unlock blur-text-image
Question Has Been Solved by an Expert!

Get step-by-step solutions from verified subject matter experts

Step: 2 Unlock
Step: 3 Unlock

Students Have Also Explored These Related General Management Questions!