

Question: Draw realizations from GPs and predictive means and uncertainty intervals, that is , redo all the plots below by yourself, and generate the codes in
Draw realizations from GPs and predictive means and uncertainty intervals, that is redo all the plots below by yourself, and generate the codes in matlab.
plots explanation:
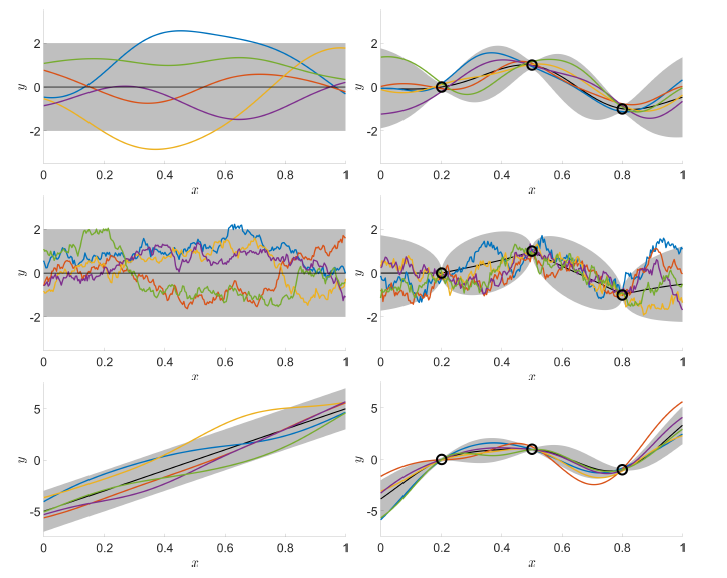
Figure : In color, realizations drawn from GPs and predictive means and uncertainty intervals in black and gray, respectively. On the left, realizations for GPs On the right, GP realizations drawn conditioned with data points denoted by black circles. From top to bottom, the GPs are zeromean with a squared exponential kernel, zeromean with an exponential kernel, and linearmean with a squared exponential kernel. Photo and text by Teemu Hrknen
Step by Step Solution
There are 3 Steps involved in it
1 Expert Approved Answer
Step: 1 Unlock

Question Has Been Solved by an Expert!
Get step-by-step solutions from verified subject matter experts
Step: 2 Unlock
Step: 3 Unlock