

Question: Draw some basic conclusions about what the ratios tell us. Annual Data 2021-01-31 2020-01-31 1.2293 1.0781 0.9157 1.1219 -10.1037 lil lil lil Lalil Lalil lil
Draw some basic conclusions about what the ratios tell us.
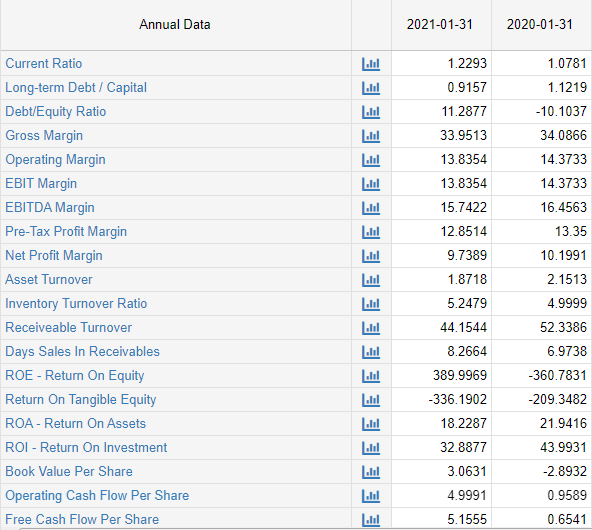
Annual Data 2021-01-31 2020-01-31 1.2293 1.0781 0.9157 1.1219 -10.1037 lil lil lil Lalil Lalil lil | lil | lil lil 11.2877 33.9513 13.8354 34.0866 14.3733 14.3733 13.8354 15.7422 16.4563 12.8514 35 10.1991 Current Ratio Long-term Debt / Capital Debt/Equity Ratio Gross Margin Operating Margin EBIT Margin EBITDA Margin Pre-Tax Profit Margin Net Profit Margin Asset Turnover Inventory Turnover Ratio Receiveable Turnover Days Sales In Receivables ROE - Return On Equity Return On Tangible Equity ROA - Return On Assets ROI - Return On Investment Book Value Per Share Operating Cash Flow Per Share Free Cash Flow Per Share 9.7389 1.8718 5.2479 2.1513 44.1544 8.2664 4.9999 52.3386 6.9738 -360.7831 -209.3482 21.9416 43.9931 389.9969 -336.1902 18.2287 32.8877 3.0631 4.9991 [lil -2.8932 lil 0.9589 0.6541 E 5.1555
Step by Step Solution
There are 3 Steps involved in it

Get step-by-step solutions from verified subject matter experts