

Question: Consider the following data. Do heavier cars really use more gasoline? Suppose a car is chosen at random. Let x be the weight of
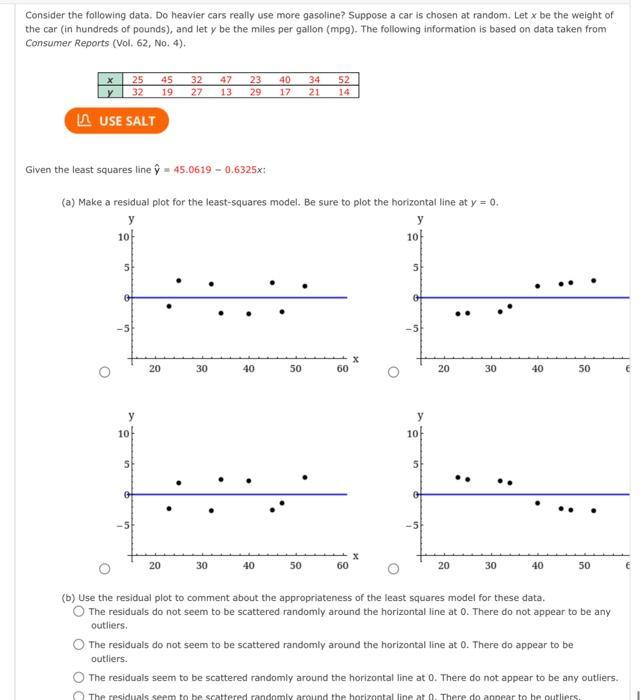
Consider the following data. Do heavier cars really use more gasoline? Suppose a car is chosen at random. Let x be the weight of the car (in hundreds of pounds), and let y be the miles per gallon (mpg). The following information is based on data taken from Consumer Reports (Vol. 62, No. 4). x LUSE SALT 10 25 32 5 y 10 Given the least squares line 45.0619-0.6325x: (a) Make a residual plot for the least-squares model. Be sure to plot the horizontal line at y = 0. y y 5 45 19 20 32 27 20 30 30 47 13 . 23 40 34 52 17 21 14 29 40 40 50 50 60 60 X 10 5 y 10 5 20 20 30 30 40 40 50 The residuals do not seem to be scattered randomly around the horizontal line at 0. There do appear to be outliers. 50 (b) Use the residual plot to comment about the appropriateness of the least squares model for these data. The residuals do not seem to be scattered randomly around the horizontal line at 0. There do not appear to be any outliers. O The residuals seem to be scattered randomly around the horizontal line at 0. There do not appear to be any outliers. The residuals seem to be scattered randomly around the horizontal line at 0. There do appear to be outliers.
Step by Step Solution
3.47 Rating (157 Votes )
There are 3 Steps involved in it
We used the the regression line to predict the y values and residual using y values predict... View full answer

Get step-by-step solutions from verified subject matter experts