

Question: Draw the graph of a function that represents the situation. Let t = 0 represent the year 2020. A manufacturing plant purchases new equipment for
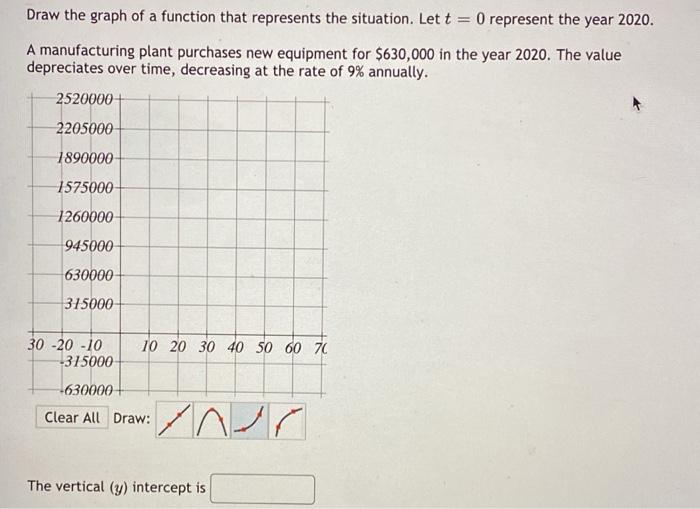
Draw the graph of a function that represents the situation. Let t = 0 represent the year 2020. A manufacturing plant purchases new equipment for $630,000 in the year 2020. The value depreciates over time, decreasing at the rate of 9% annually. 2520000+ 2205000 1890000 1575000 1260000 945000 630000 315000 30 -20 -10 -315000 10 20 30 40 50 60 70 -630000 Clear All Draw: The vertical (y) intercept is
Step by Step Solution
There are 3 Steps involved in it
1 Expert Approved Answer
Step: 1 Unlock

Question Has Been Solved by an Expert!
Get step-by-step solutions from verified subject matter experts
Step: 2 Unlock
Step: 3 Unlock