

Question: Draw the p- chart and highlight the process is control or out of control. Day Non-Conformers or Defective Sample size 1 10 224 2 12
Draw the p- chart and highlight the process is control or out of control.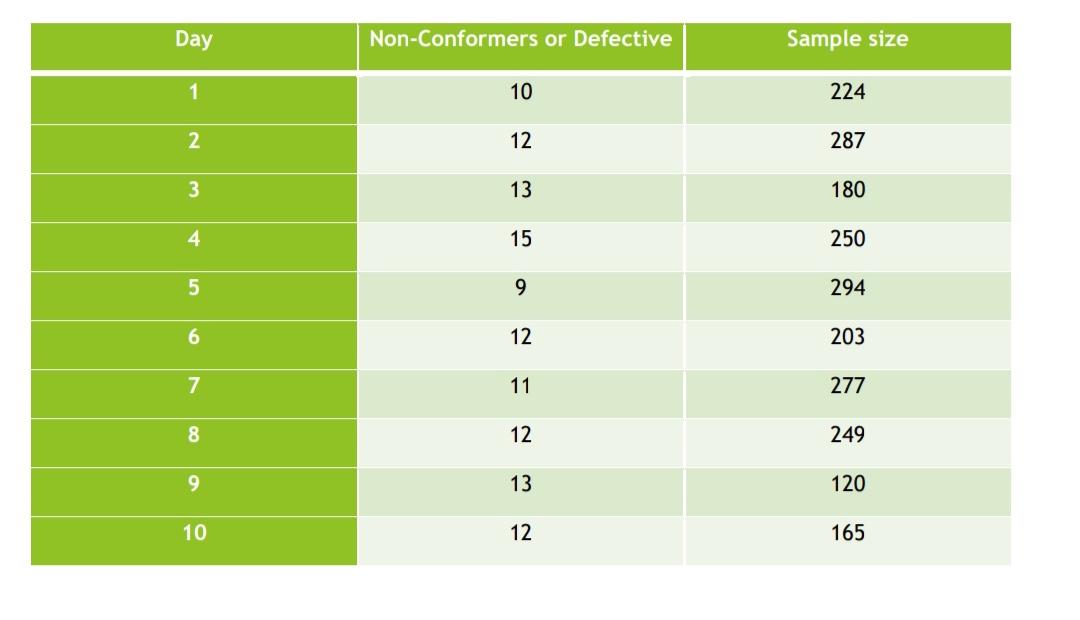
Day Non-Conformers or Defective Sample size 1 10 224 2 12 287 13 180 4 15 250 9. 294 6. 12 203 7 11 277 8 12 249 9. 13 120 10 12 165
Step by Step Solution
There are 3 Steps involved in it
1 Expert Approved Answer
Step: 1 Unlock

Question Has Been Solved by an Expert!
Get step-by-step solutions from verified subject matter experts
Step: 2 Unlock
Step: 3 Unlock