

Question: Draw the velocity graphs for an object whose motion produced the posi- tion-time graphs shown below on the left. Position is in meters (m)
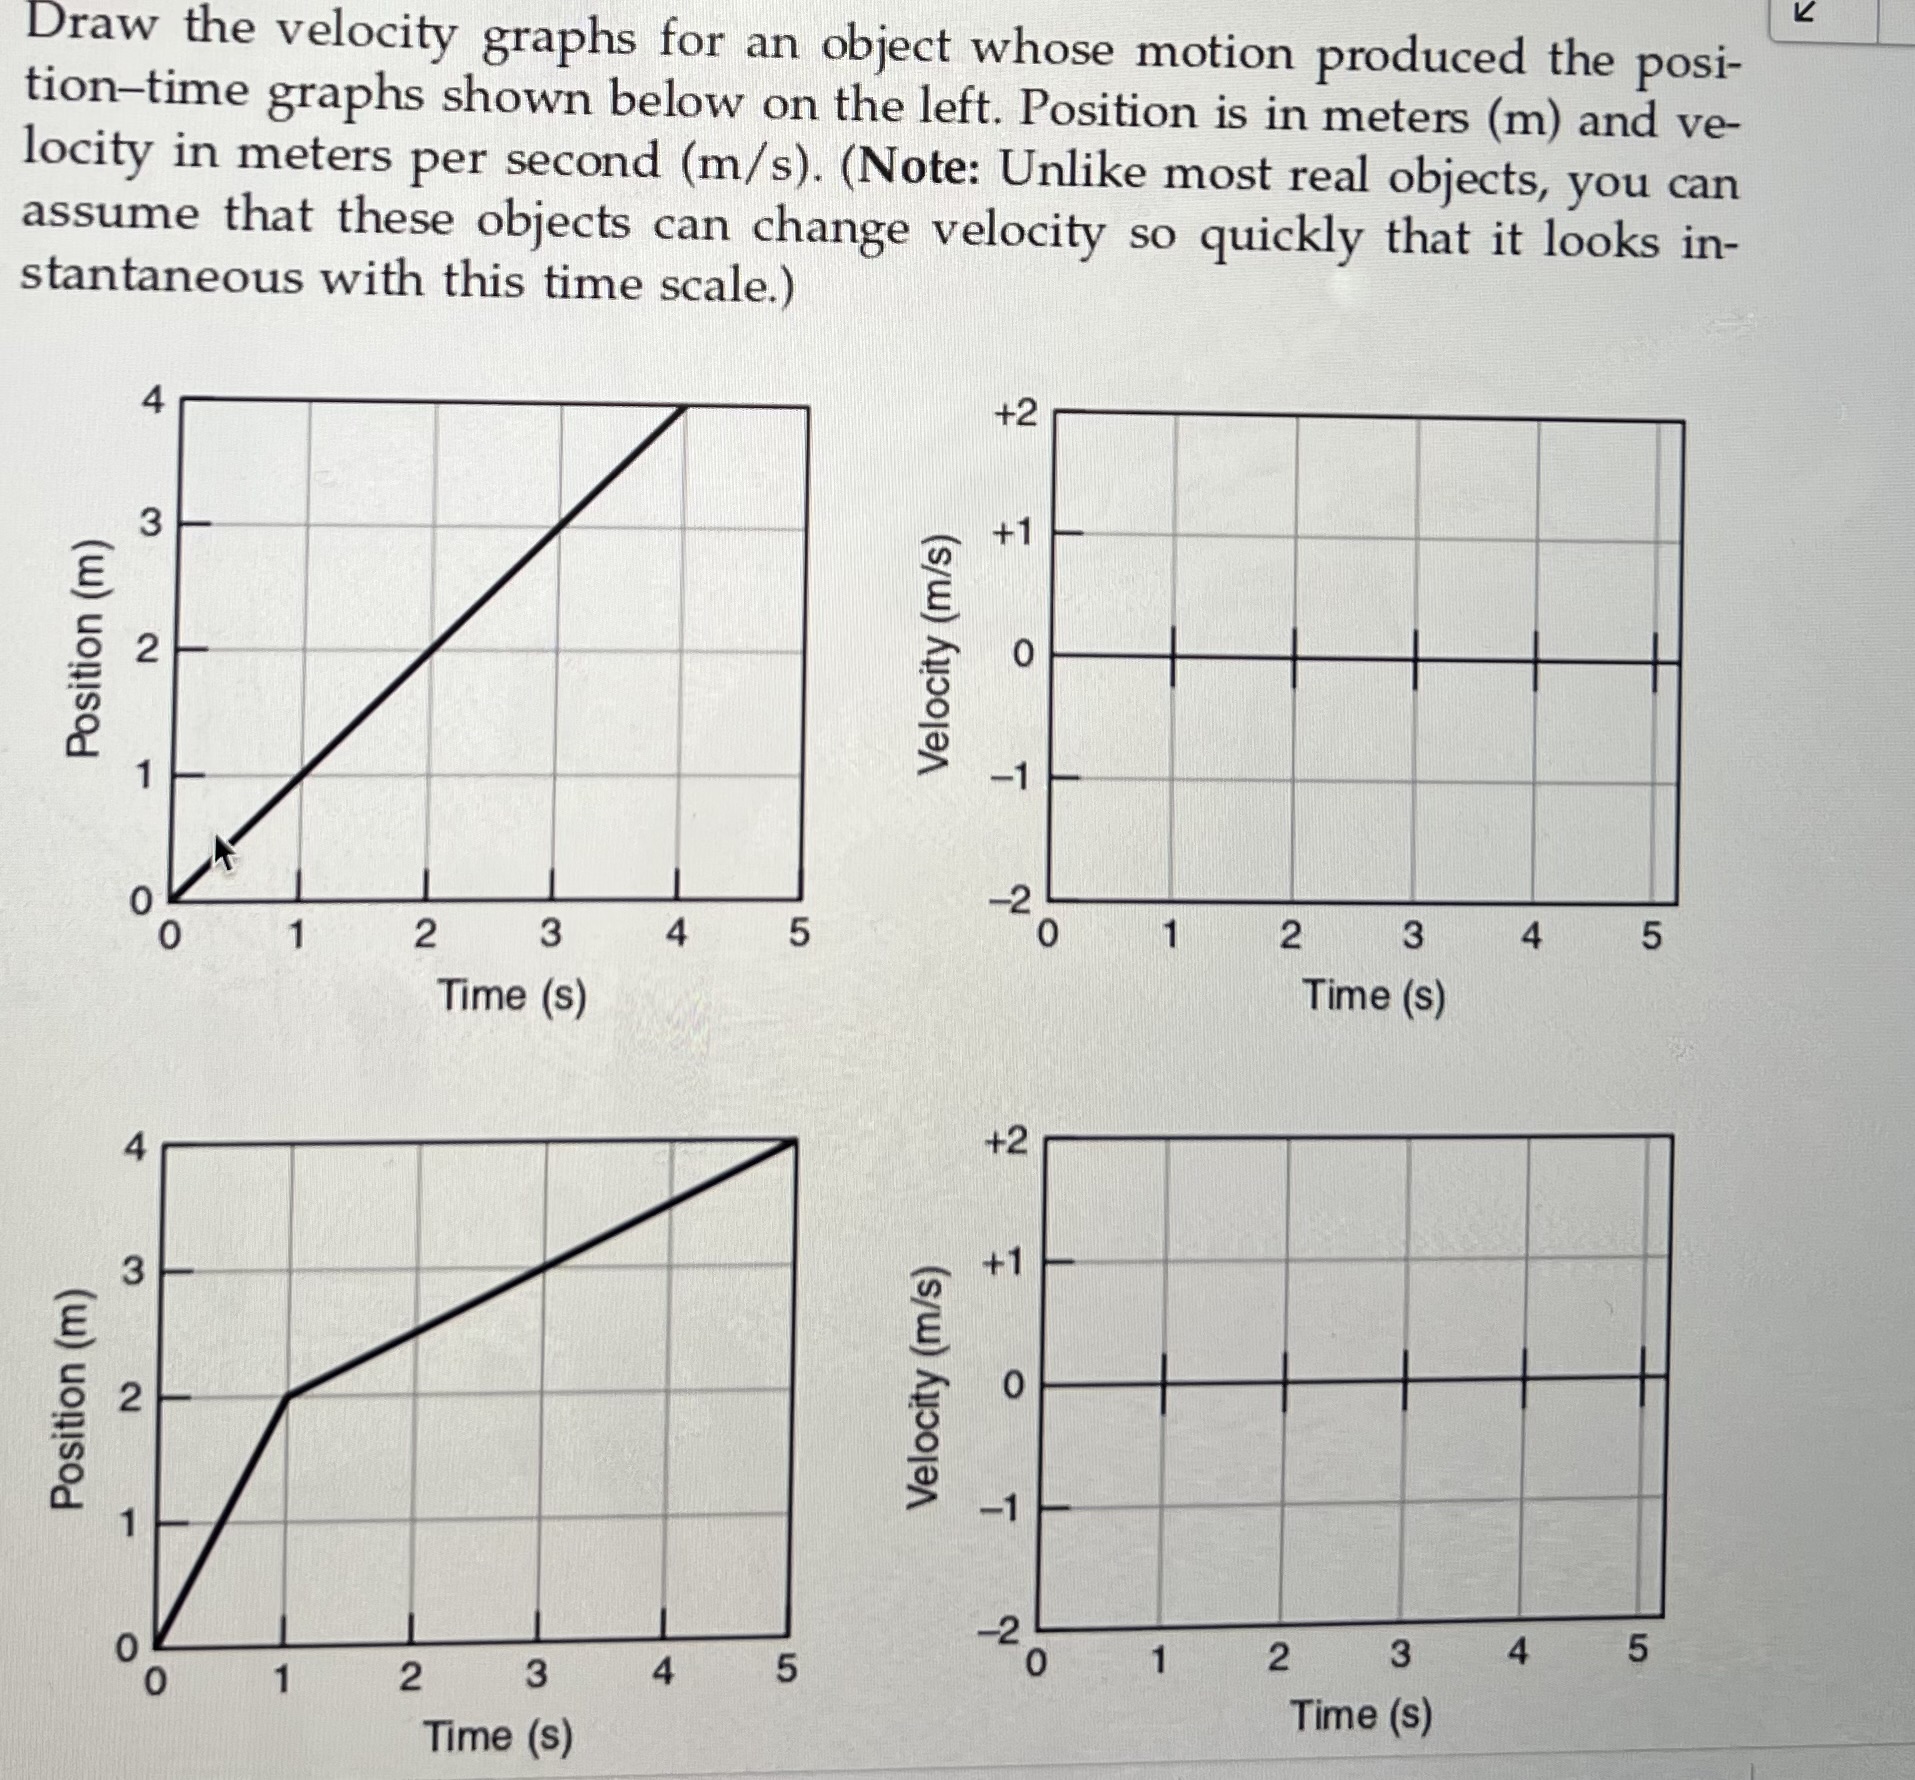
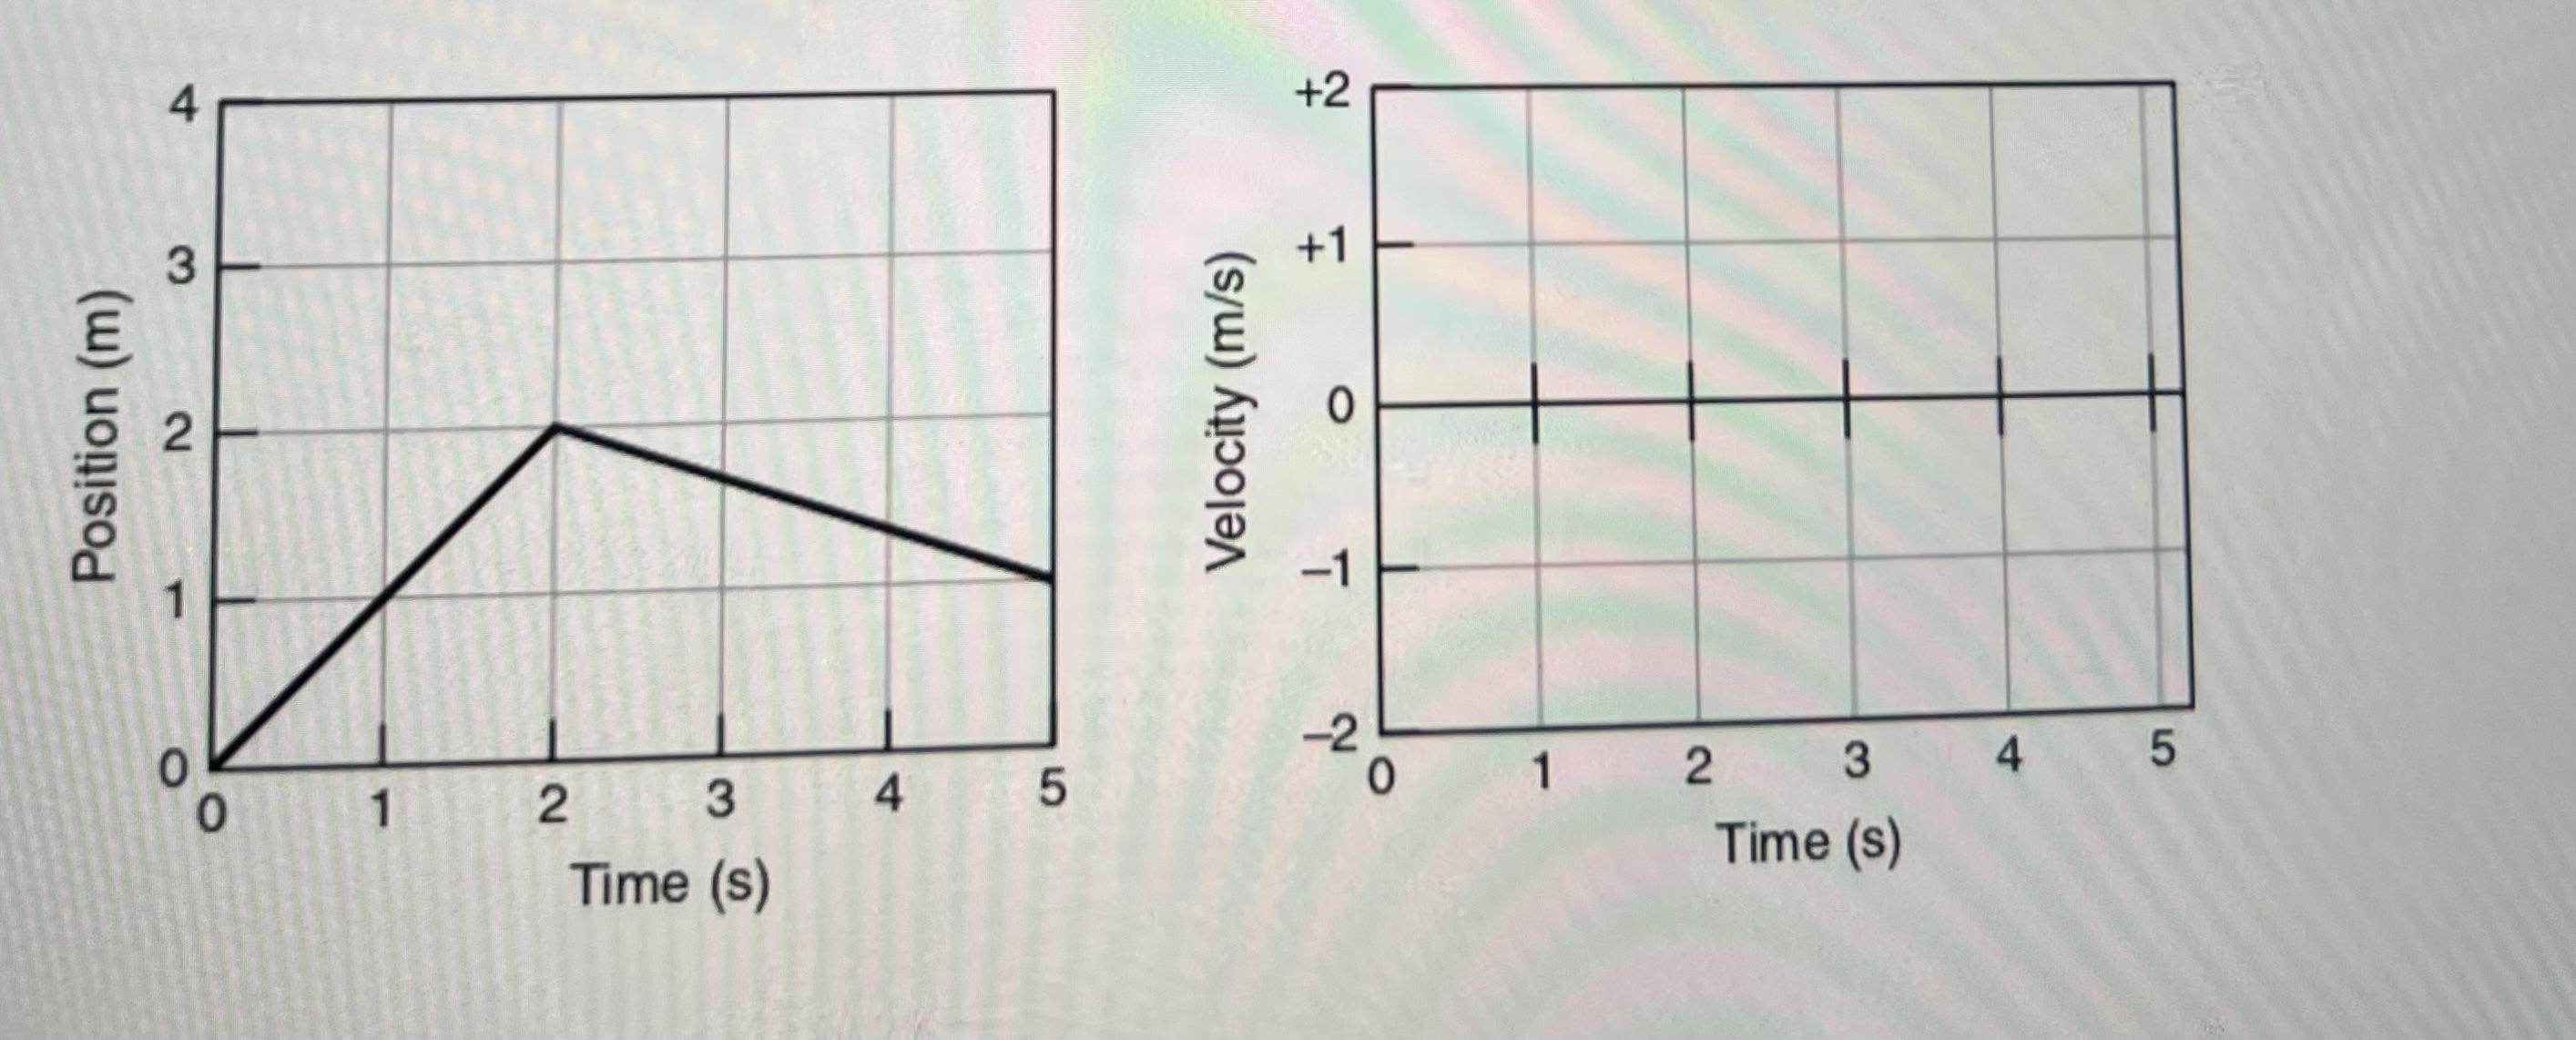
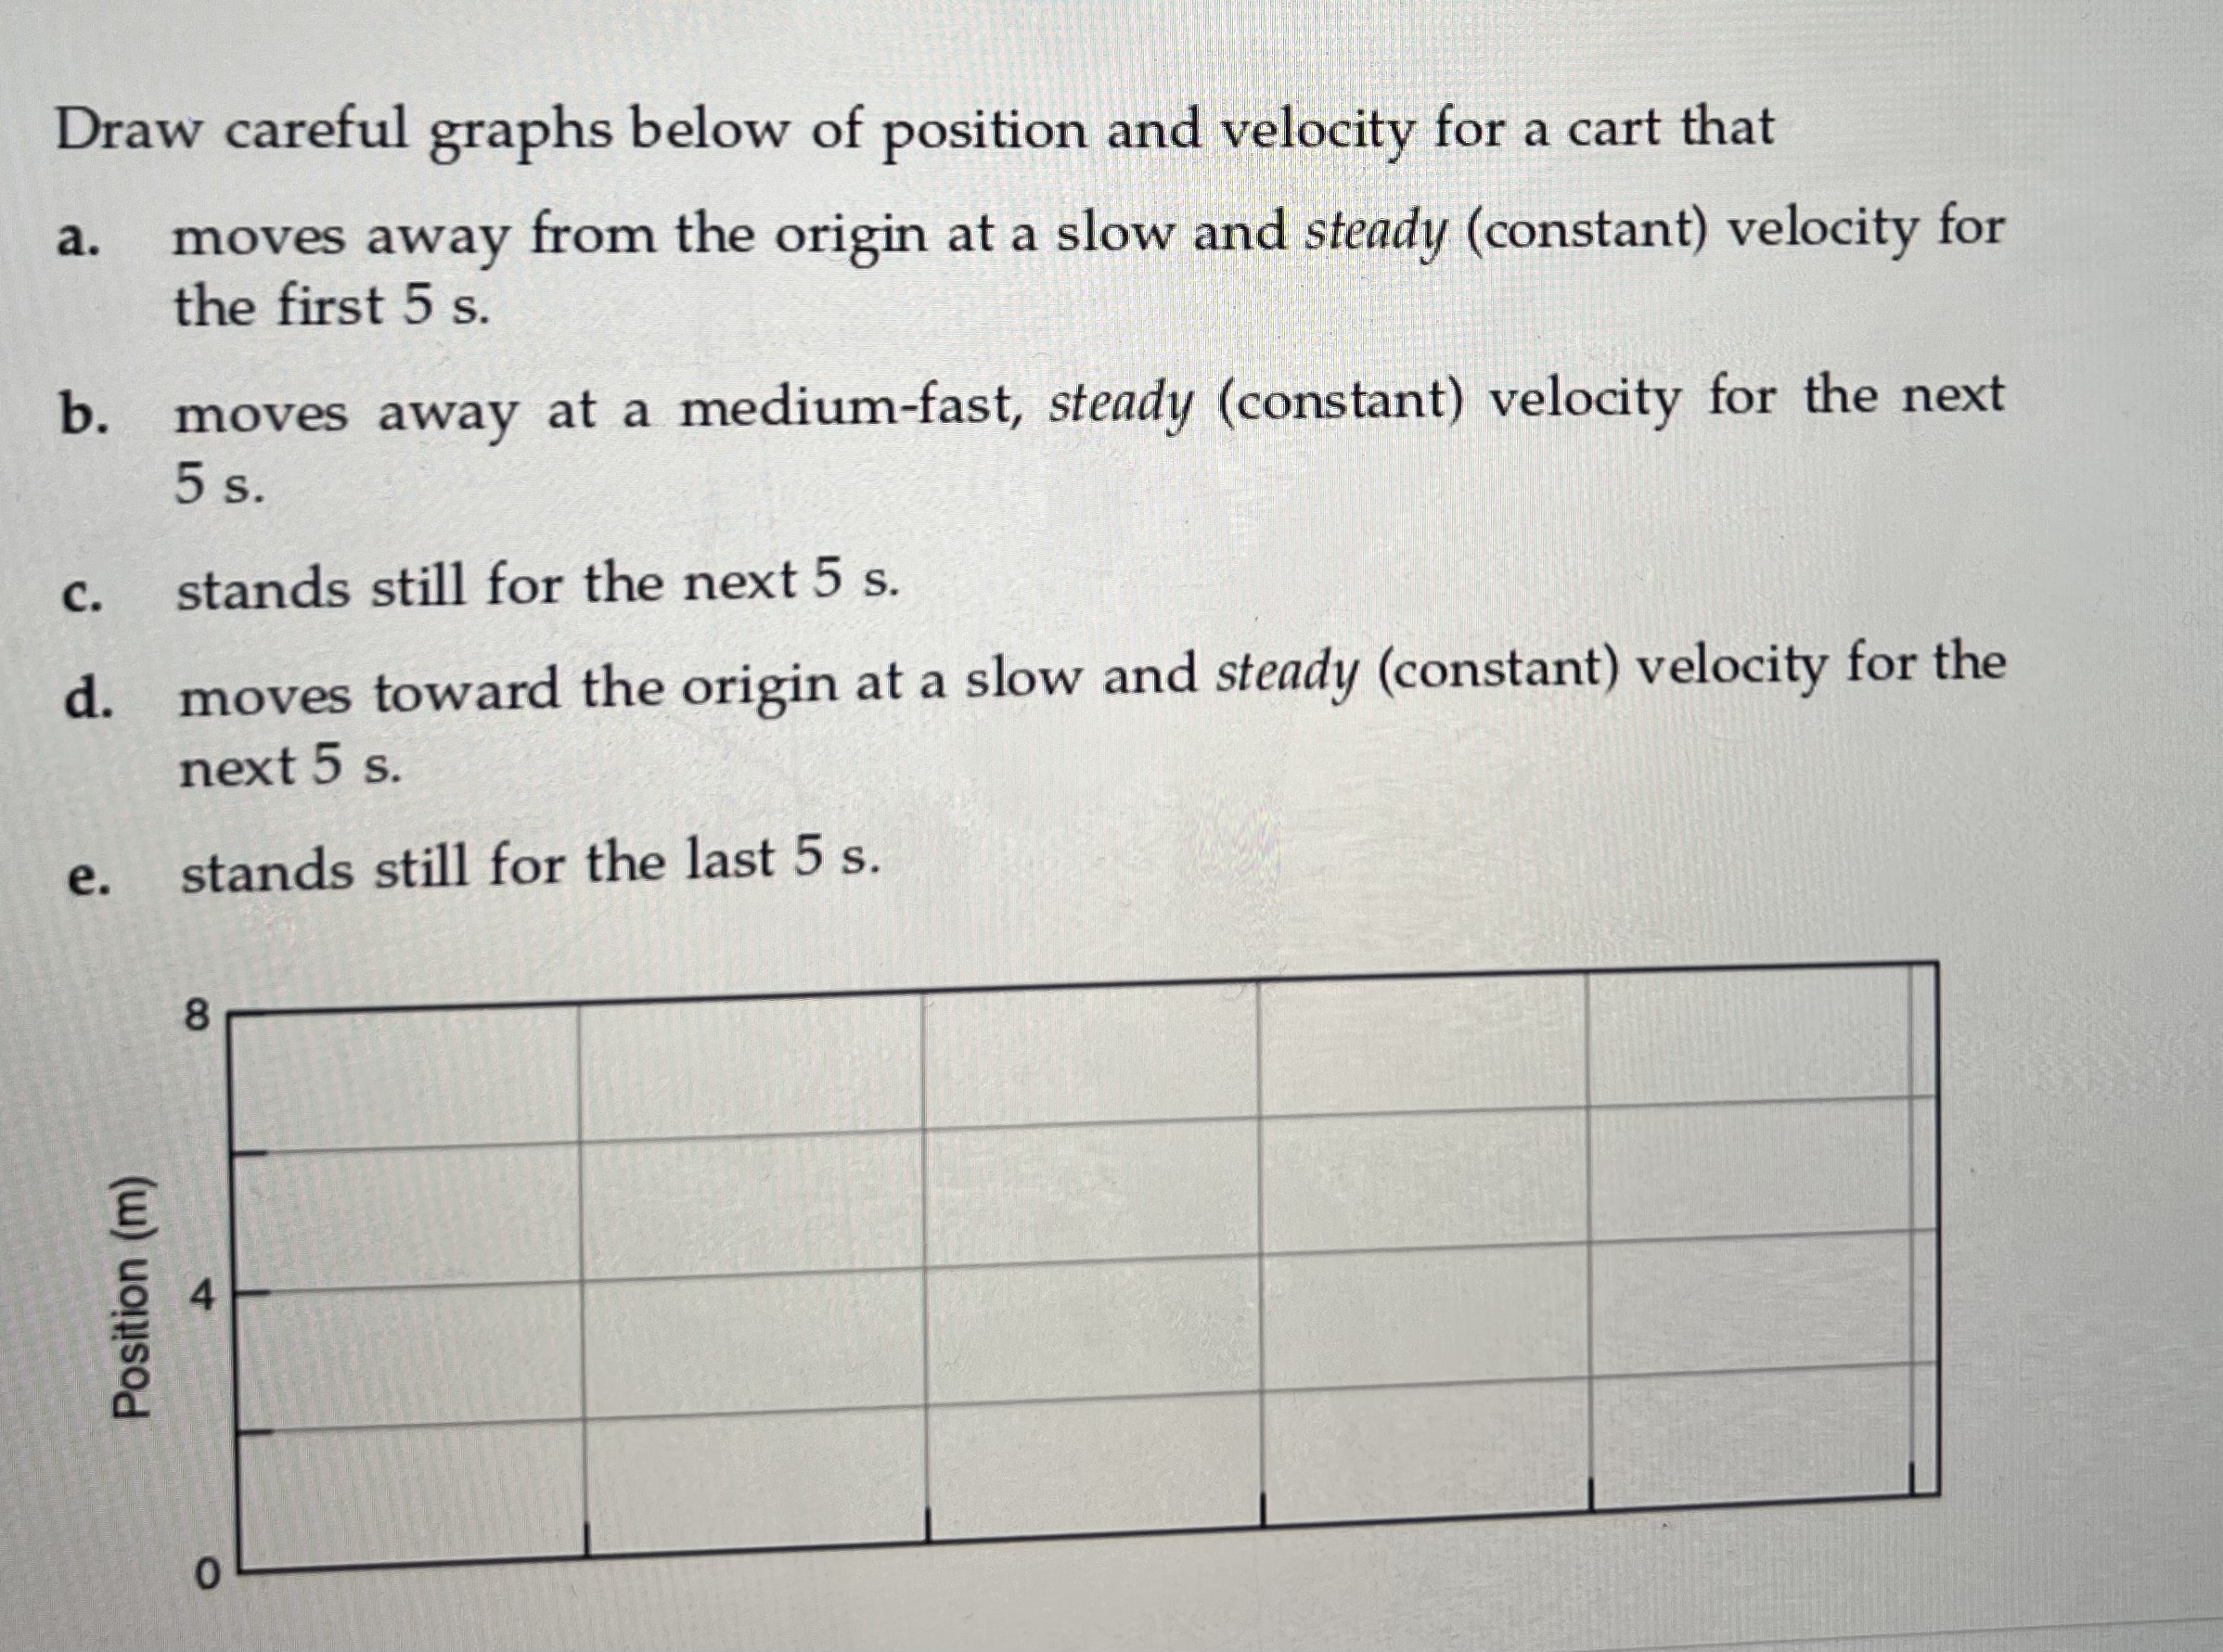
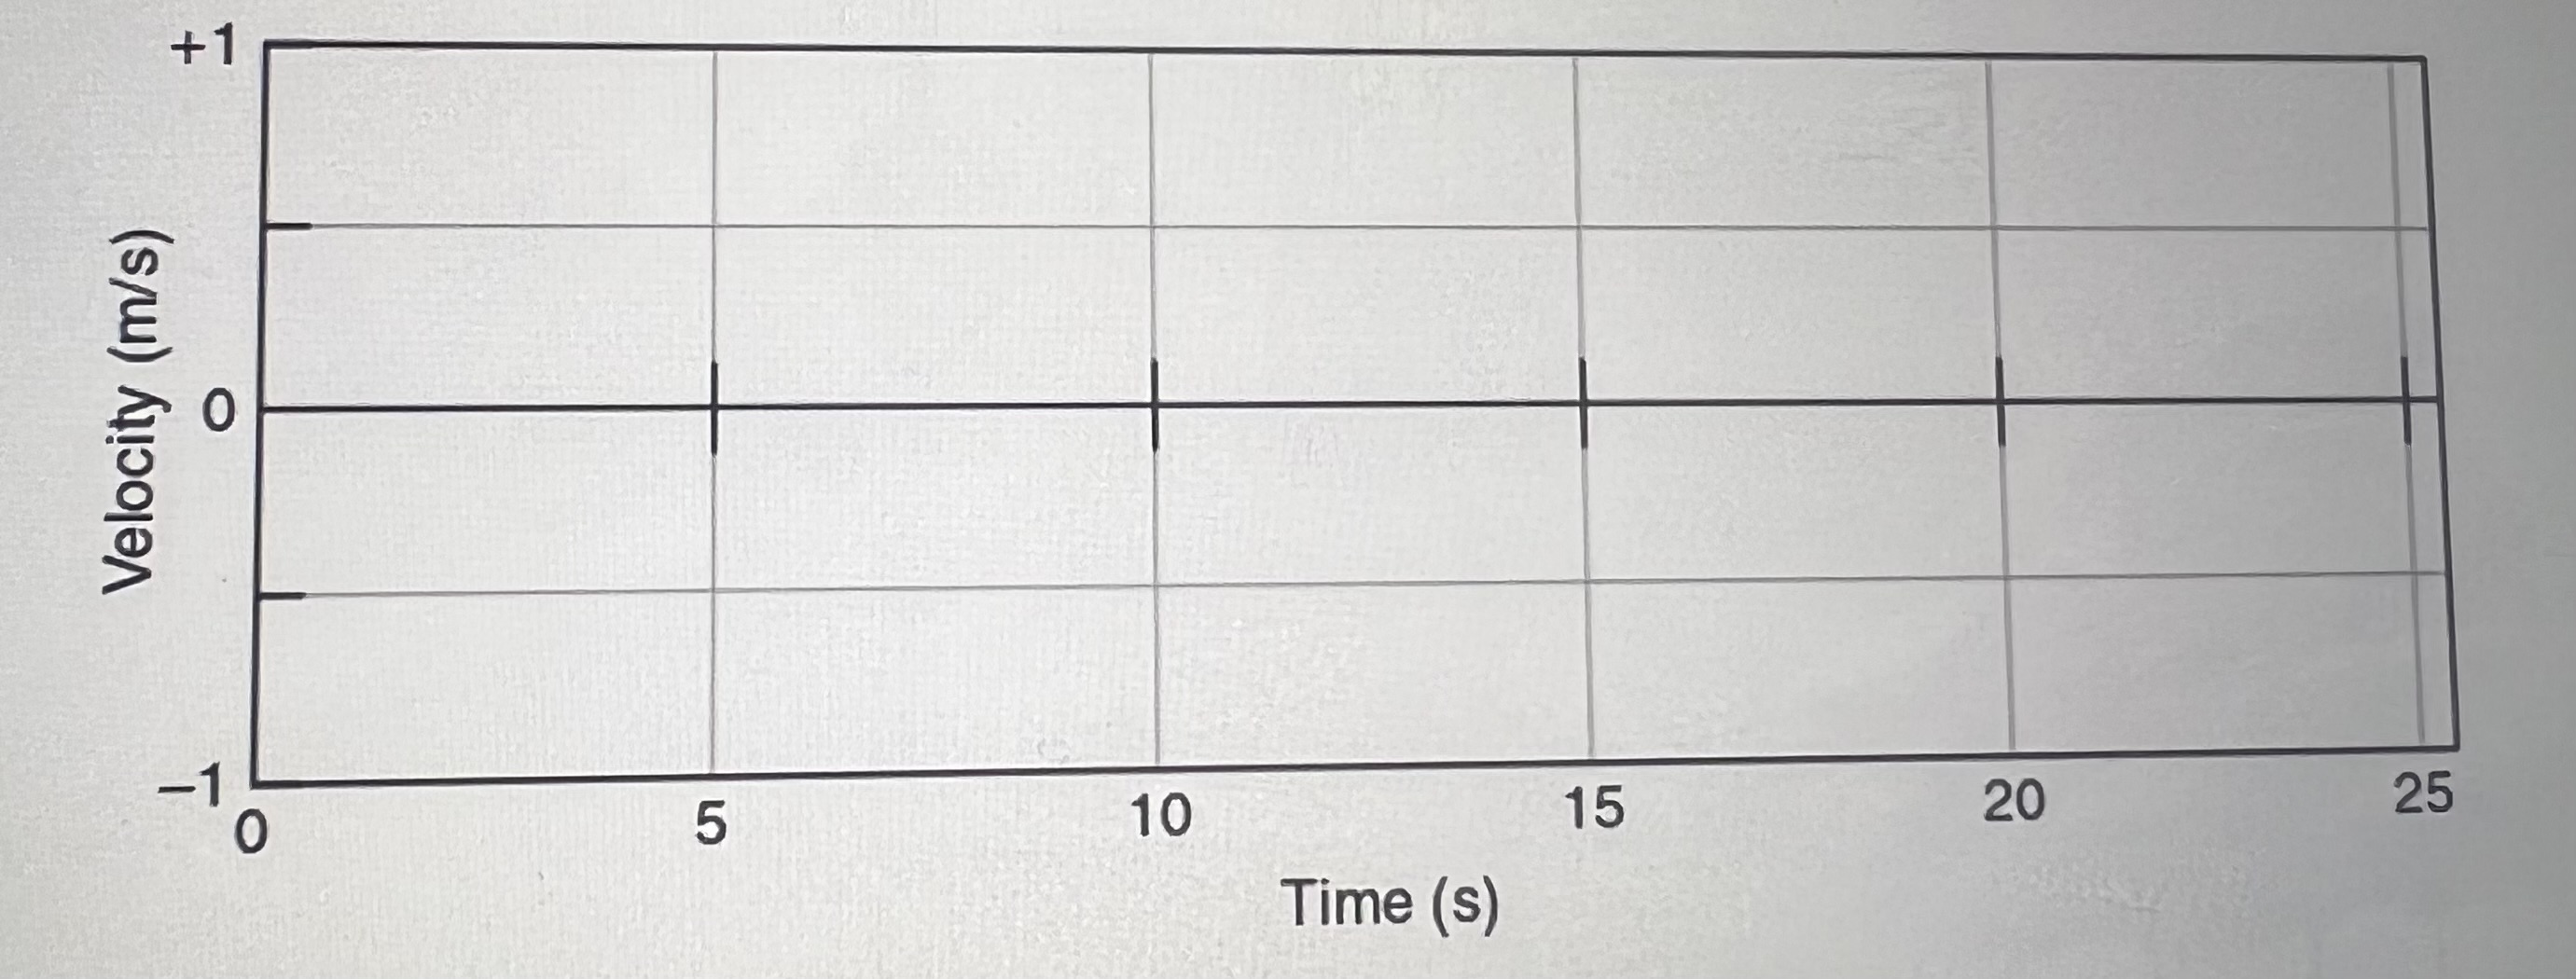
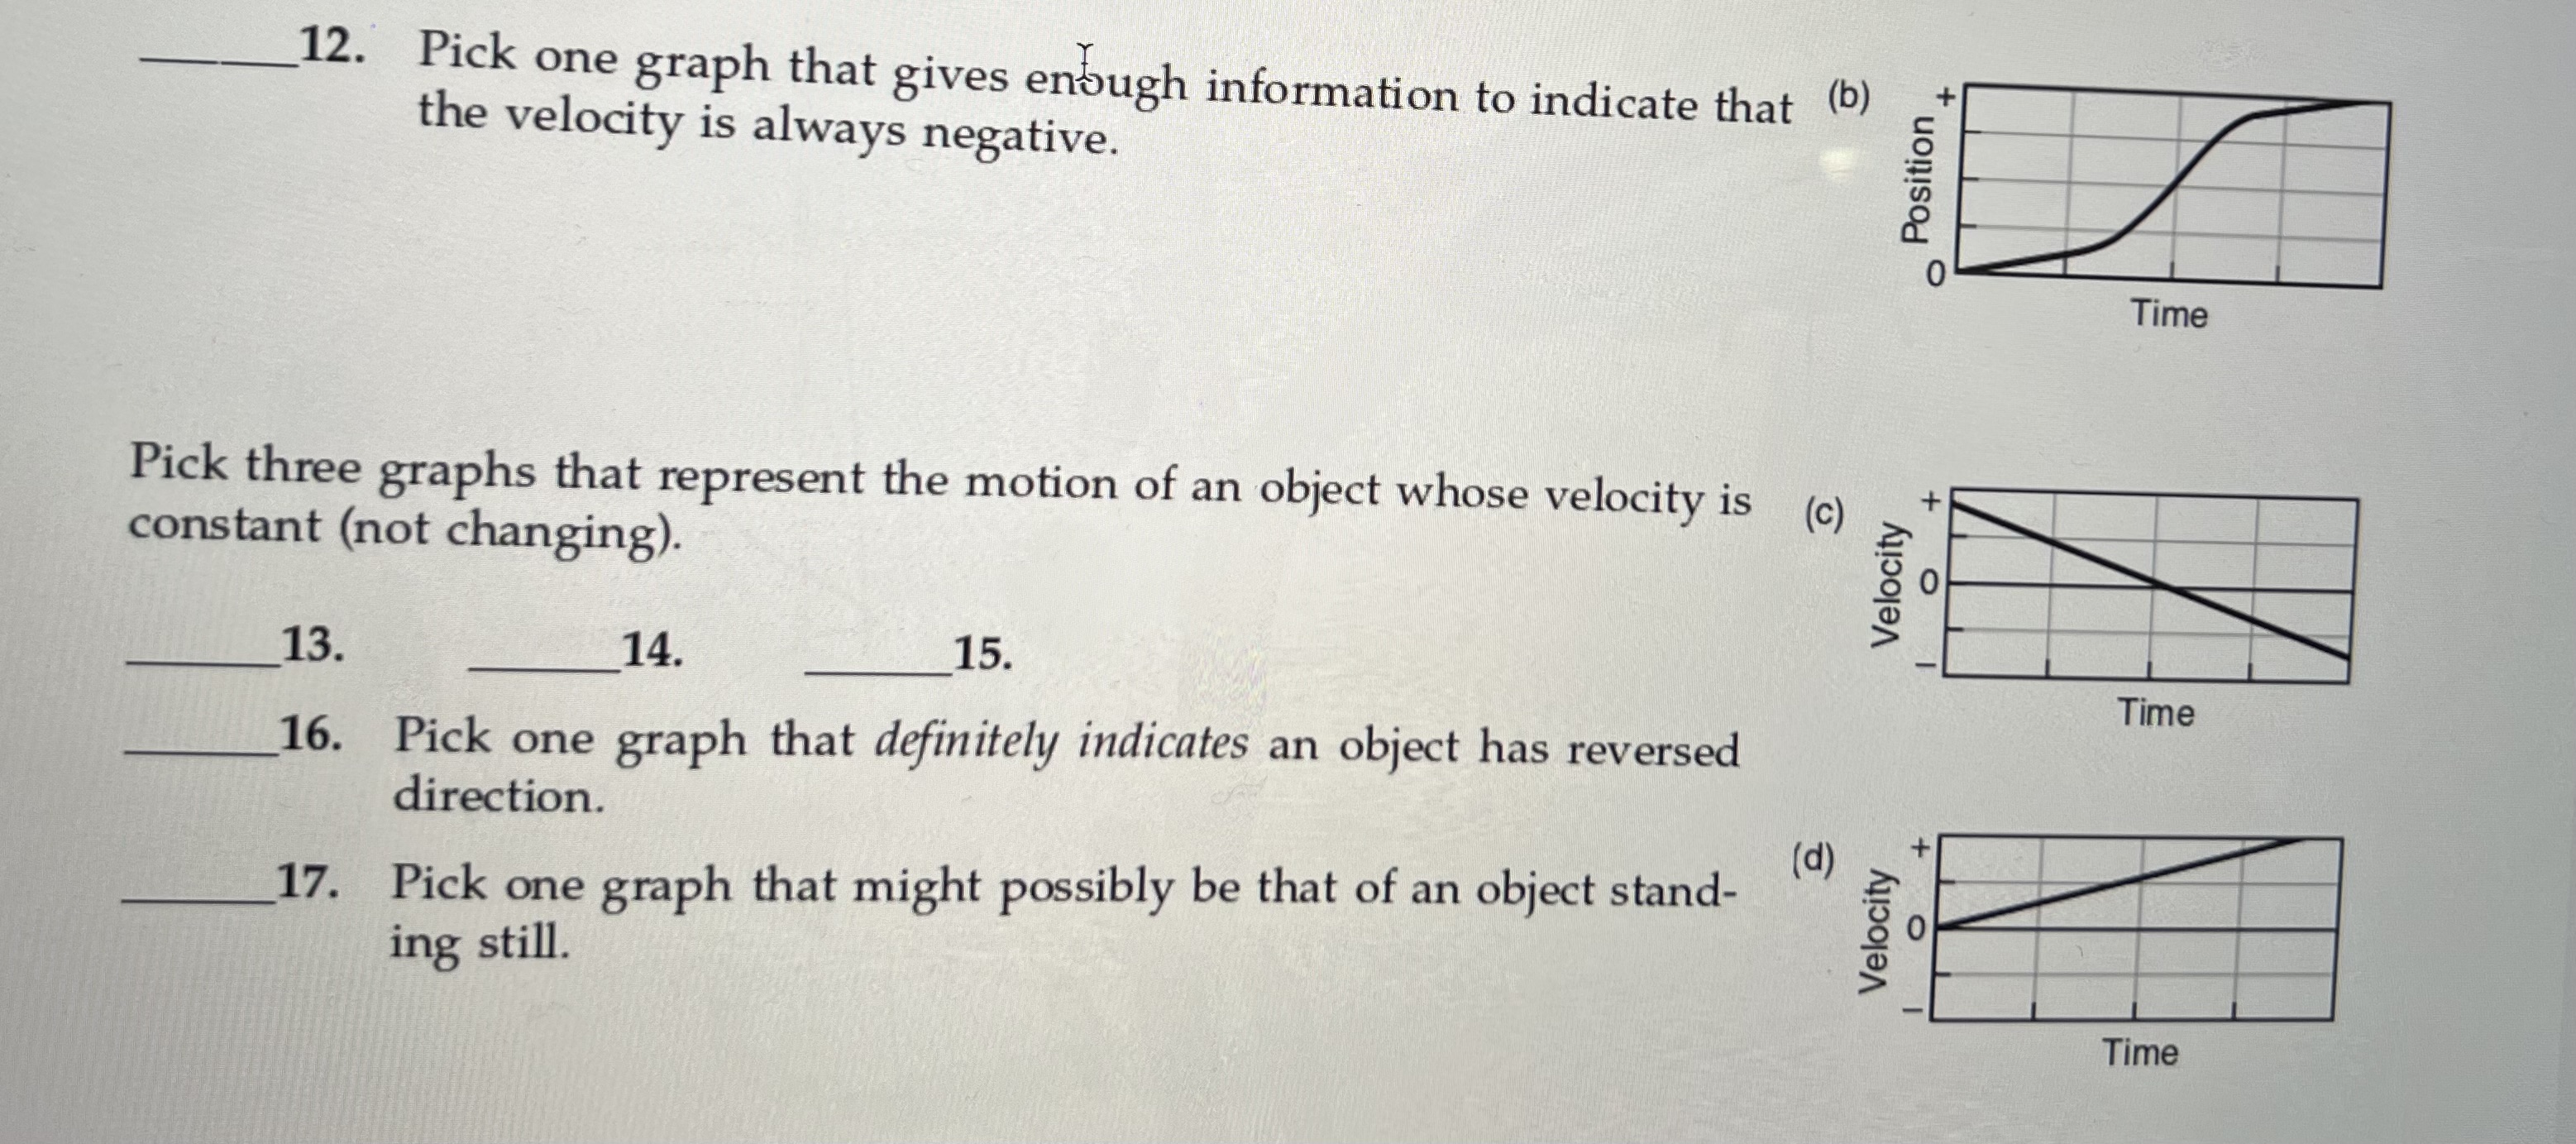
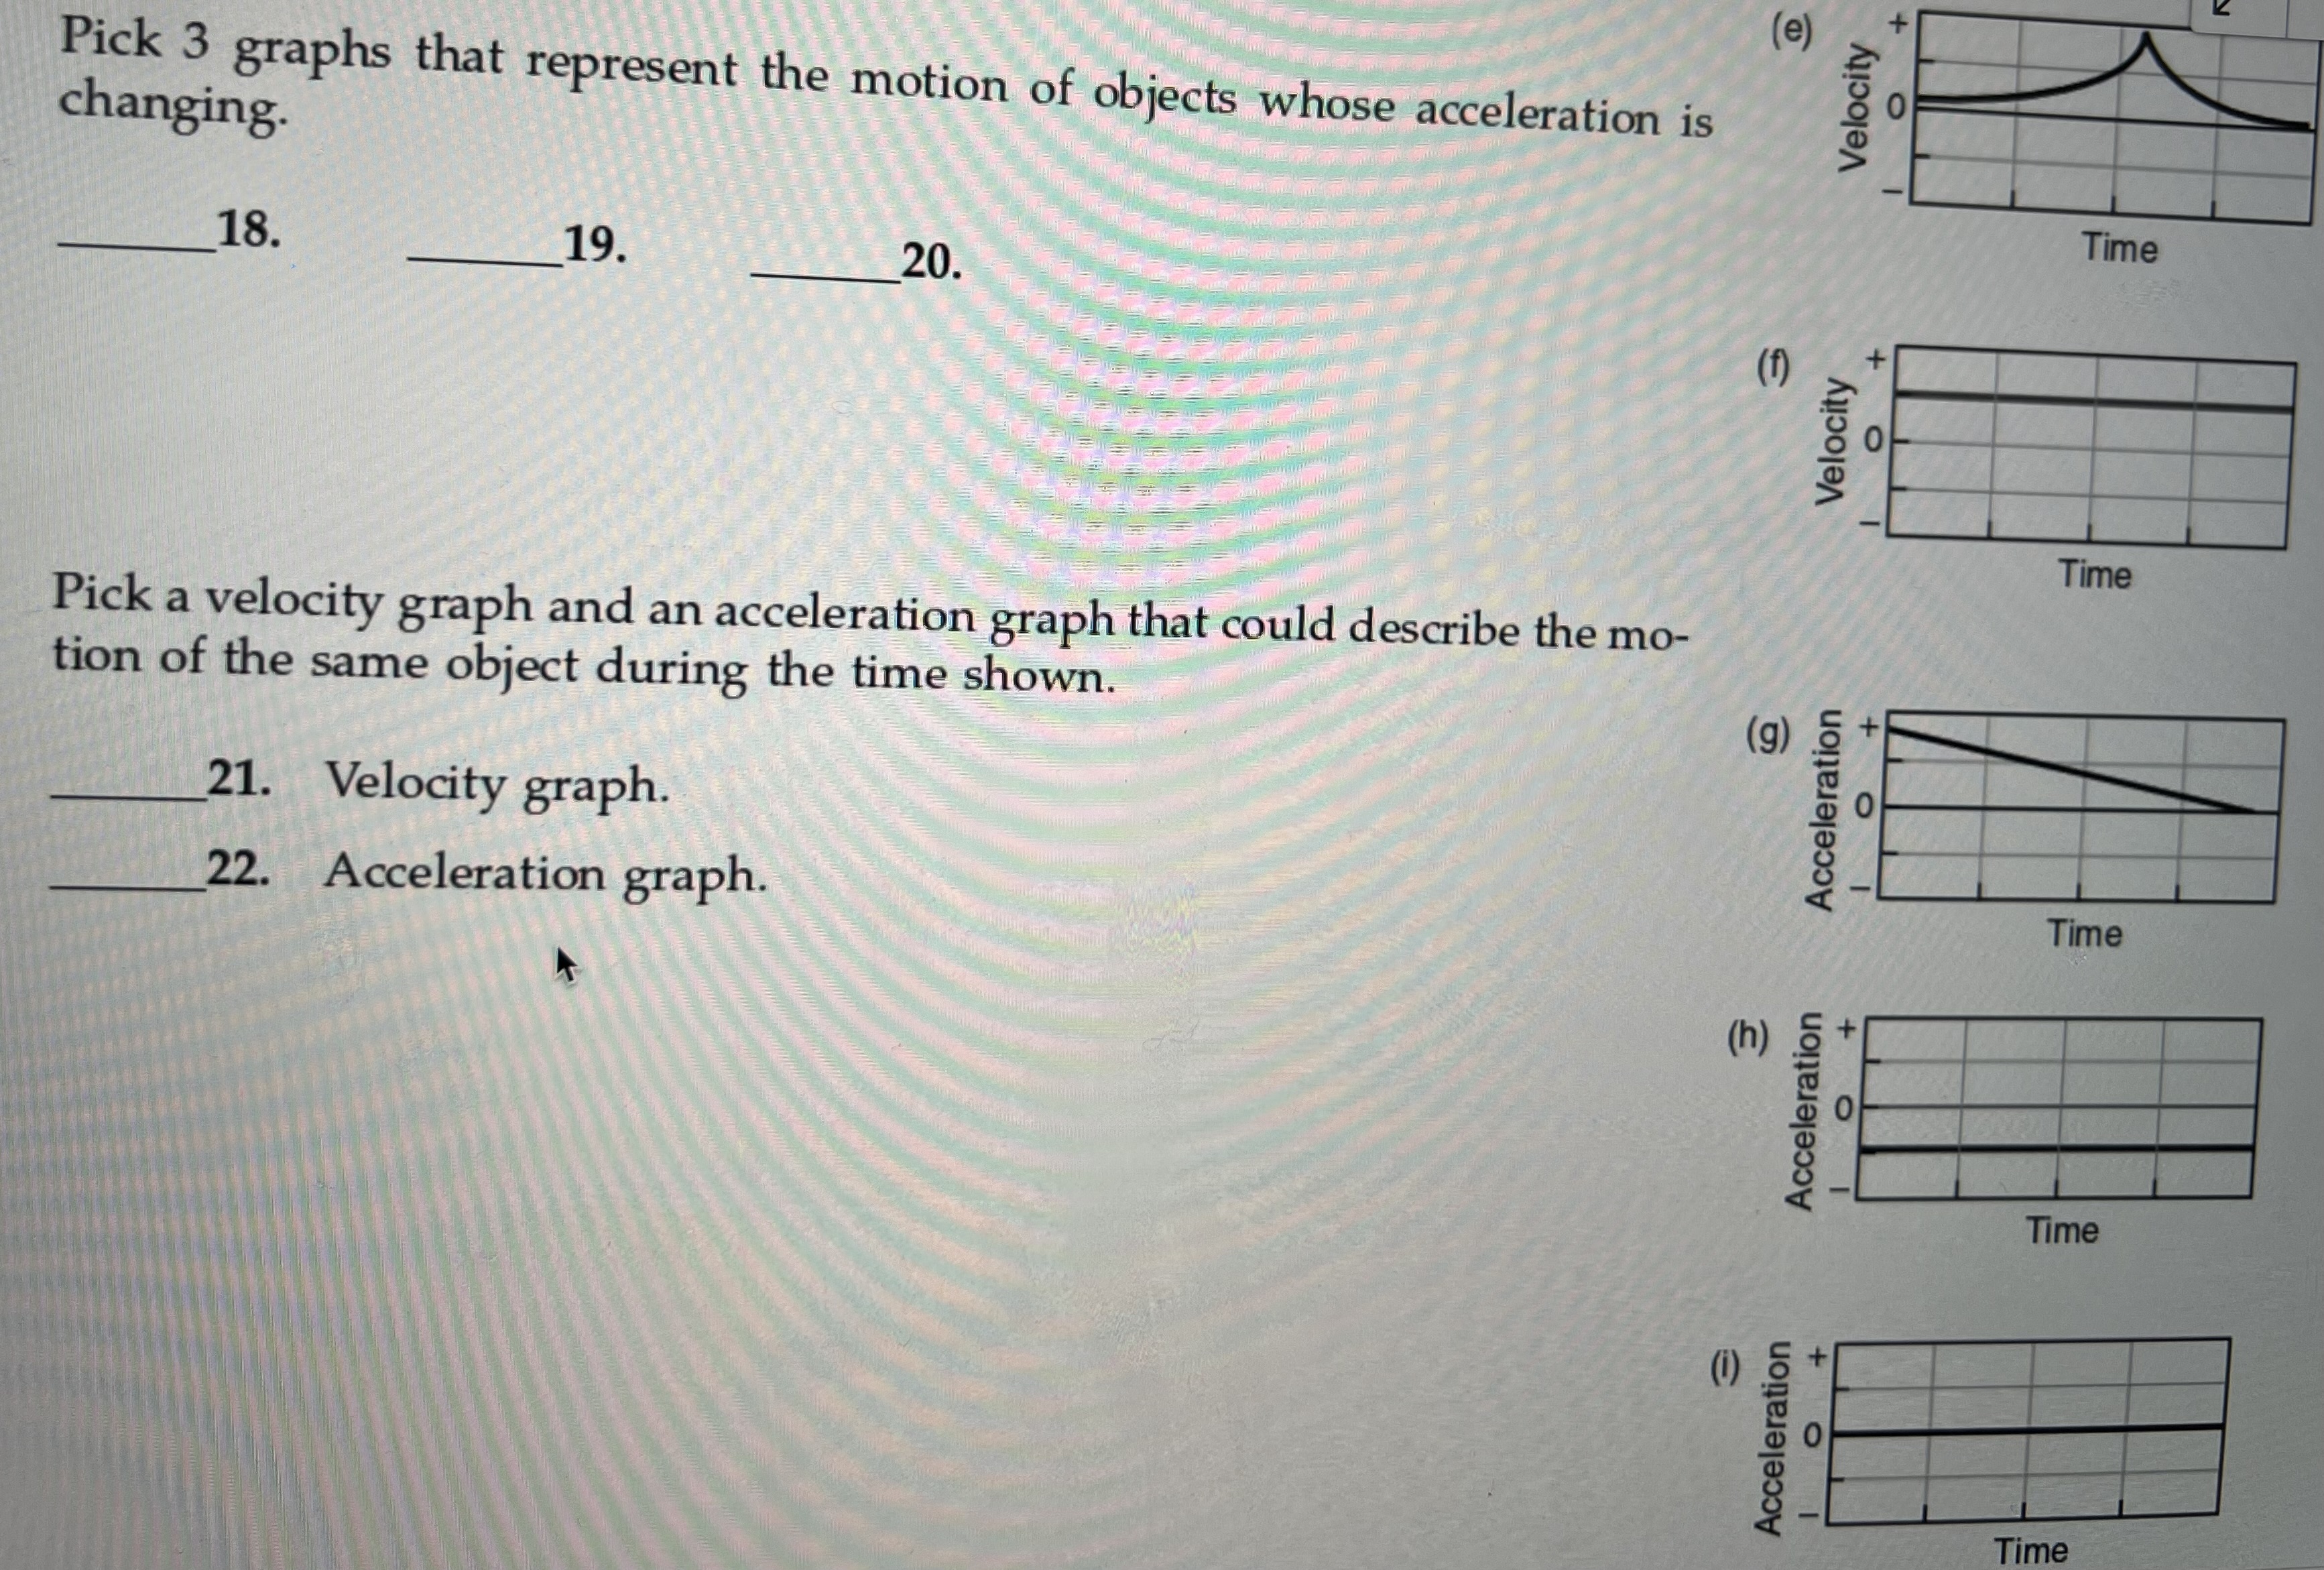
Draw the velocity graphs for an object whose motion produced the posi- tion-time graphs shown below on the left. Position is in meters (m) and ve- locity in meters per second (m/s). (Note: Unlike most real objects, you can assume that these objects can change velocity so quickly that it looks in- stantaneous with this time scale.) Position (m) Position (m) 4 3 N 3 0 1 1 2 3 Time (s) 3 Time (s) 2 4 4 5 5 Velocity (m/s) Velocity (m/s) +2 +1 O -2 +2 +1 O -2 0 0 1 1 2 3 Time (s) 2 3 Time (s) 4 4 5 5 y Position (m) 3 2 0 0 3 Time (s) 2 4 5 Velocity (m/s) +2 + -2 1 2 3 Time (s) 4 5 Draw careful graphs below of position and velocity for a cart that a. moves away from the origin at a slow and steady (constant) velocity for the first 5 s. b. C. d. e. Position (m) moves away at a medium-fast, steady (constant) velocity for the next 5 s. stands still for the next 5 s. moves toward the origin at a slow and steady (constant) velocity for the next 5 s. stands still for the last 5 s. 8 0 +1 Velocity (m/s) -1 0 5 10 Time (s) 15 20 25 12. Pick one graph that gives enough information to indicate that (b) the velocity is always negative. (c) Pick three graphs that represent the motion of an object whose velocity is constant (not changing). 13. 14. 15. 16. Pick one graph that definitely indicates an object has reversed direction. 17. Pick one graph that might possibly be that of an object stand- ing still. (d) Position Velocity Velocity + O I + + O I Time Time Time Pick 3 graphs that represent the motion of objects whose acceleration is changing. 18. 19. 20. Pick a velocity graph and an acceleration graph that could describe the mo- tion of the same object during the time shown. 21. Velocity graph. 22. Acceleration graph. (e) (f) (g) Acceleration Velocity Velocity Acceleration Acceleration O I + O I + OI + O I + OI Time Time Time Time Time
Step by Step Solution
There are 3 Steps involved in it
I have attached the solut... View full answer

Get step-by-step solutions from verified subject matter experts