

Question: Drawing Gantt Chart: A Gantt Chart visually represents the project schedule. Let's create a simple Gantt Chart based on the expected completion times:
Drawing Gantt Chart:
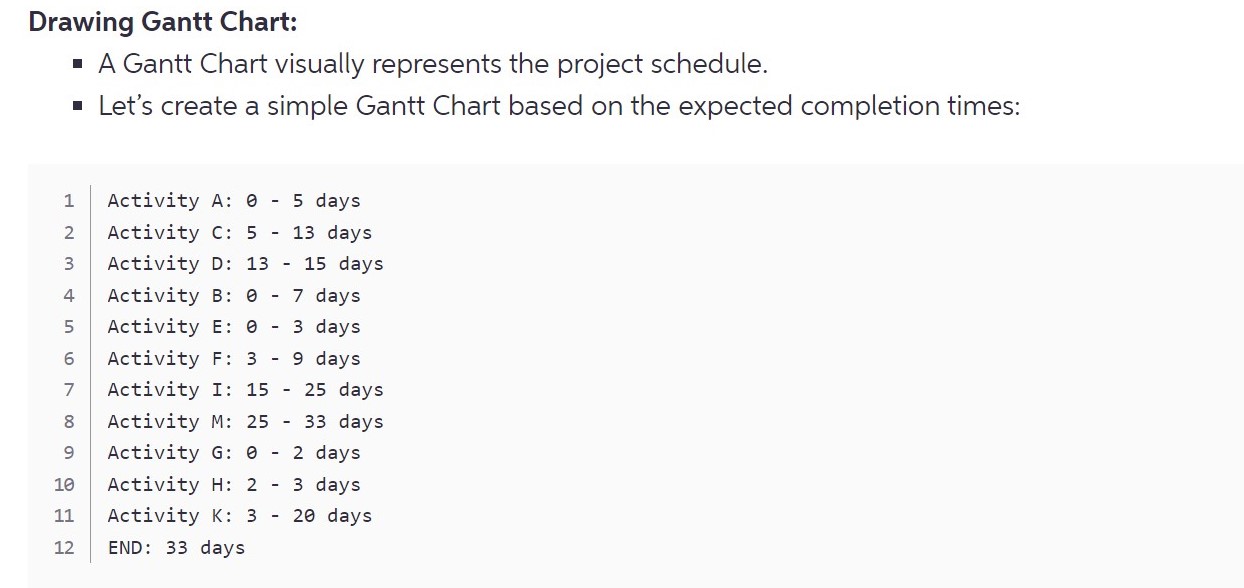
A Gantt Chart visually represents the project schedule.
Let's create a simple Gantt Chart based on the expected completion times:
Step by Step Solution
There are 3 Steps involved in it
1 Expert Approved Answer
Step: 1 Unlock

Question Has Been Solved by an Expert!
Get step-by-step solutions from verified subject matter experts
Step: 2 Unlock
Step: 3 Unlock