

Question: Drop down boxes are different for the different numbers. first and last question is true or false Read the following passage of text and answer
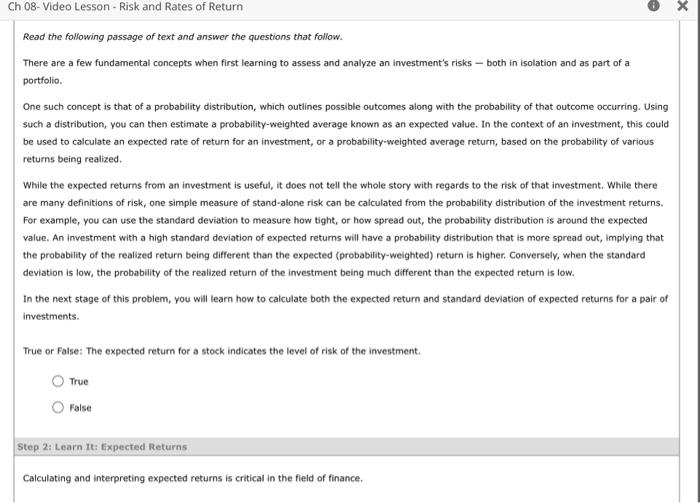
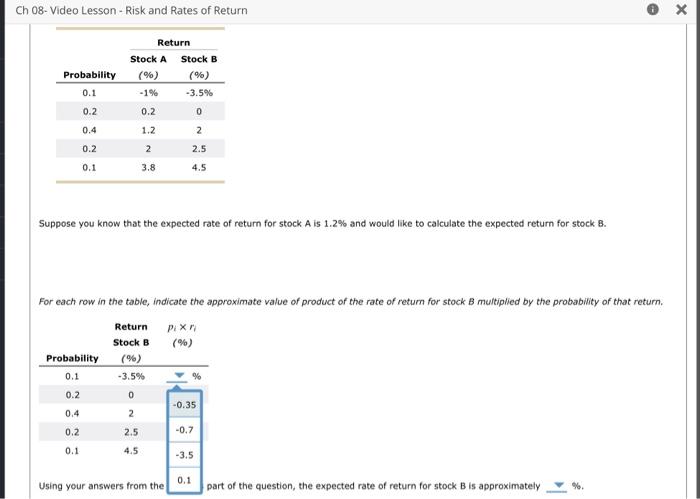
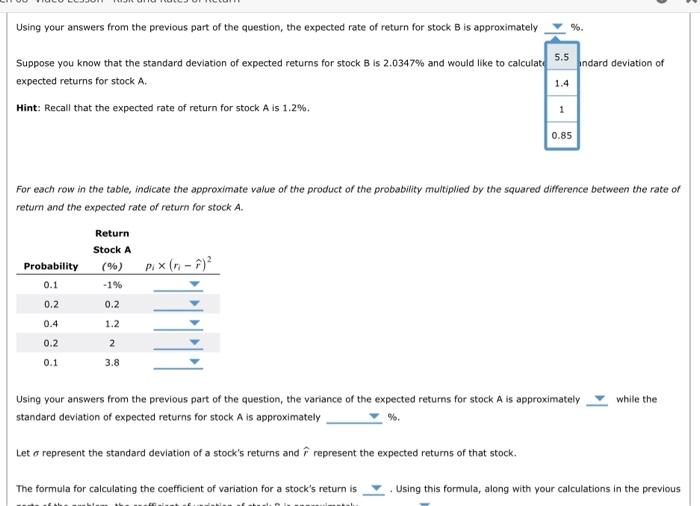
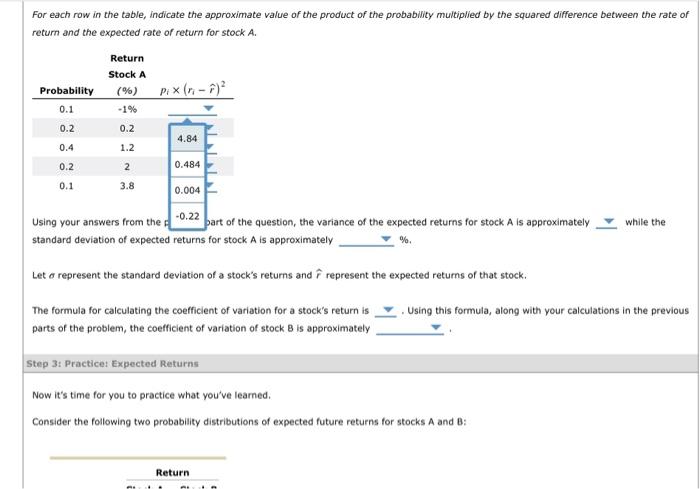
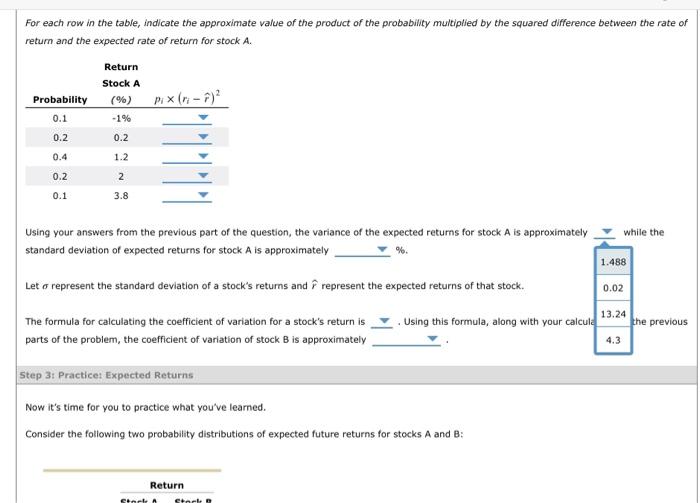
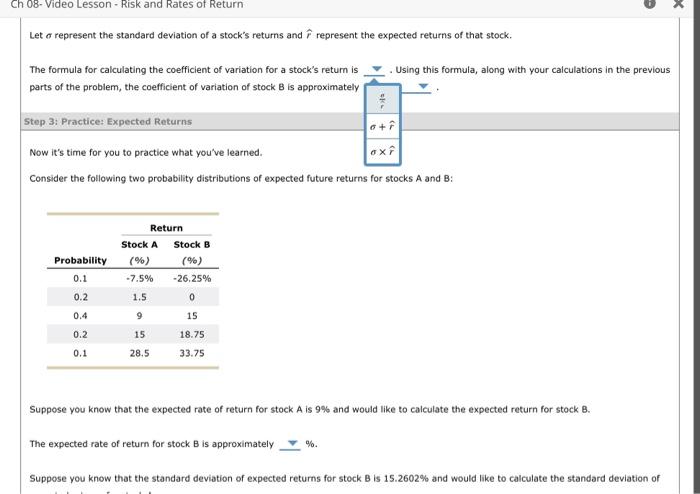
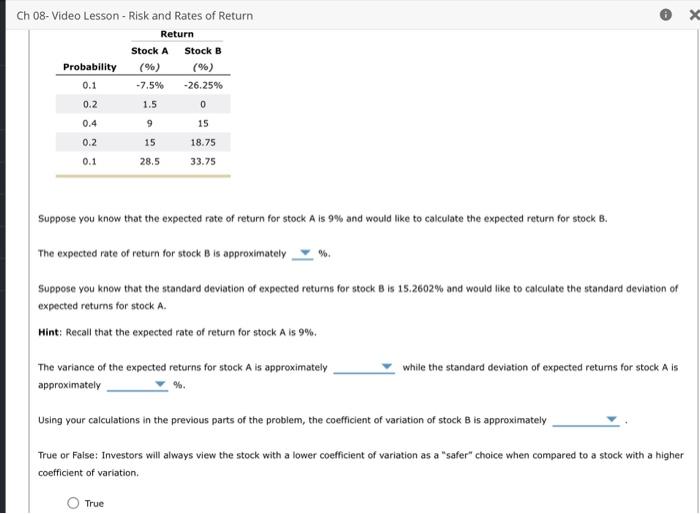
Read the following passage of text and answer the questions that follow. There are a few fundamental concepts when first learning to assess and analyze an investment's risks - both in isolation and as part of a portfolio. One such concept is that of a probability distribution, which outlines possible outcomes along with the probability of that outcome occurring. Using such a distribution, you can then estimate a probability-weighted average known as an expected value. In the context of an investment, this could be used to calculate an expected rate of return for an investment, or a probability-weighted average return, based on the probability of various returns being realized. While the expected returns from an investment is useful, it does not tell the whole story with regards to the risk of that investment. While there are many definitions of risk, one simple measure of stand-alone risk can be calculated from the probability distribution of the investment returns. For example, you can use the standard deviation to measure how tight, or how spread out, the probability distribution is around the expected value. An investment with a high standard deviation of expected returns will have a probability distribution that is more spread out, implying that the probability of the realized return being different than the expected (probability-weighted) return is higher. Conversely, when the standard deviation is low, the probability of the realized return of the investment being much different than the expected return is low. In the next stage of this problem, you will learn how to calculate both the expected return and standard deviation of expected returns for a pair of investments. True or False: The expected return for a stock indicates the level of risk of the investment. True False Step 2: Learn 1t: Expected Returns Calculating and interpreting expected returns is critical in the field of finance. Ch 08- Video Lesson - Risk and Rates of Return Suppose you know that the expected rate of return for stock A is 1.2% and would like to calculate the expected return for stock B. Using your answers from the previous part of the question, the expected rate of return for stock B is approximately %. Suppose you know that the standard deviation of expected returns for stock B is 2.0347% and would like to calculat expected returns for stock A. 5.5 1.4 Hint: Recall that the expected rate of return for stock A is 1.2%. For each row in the table, indicate the approximate value of the product of the probability multiplied by the squared difference between the rate of return and the expected rate of return for stock A. Using your answers from the previous part of the question, the variance of the expected returns for stock A is approximately while the standard deviation of expected returns for stock A is approximately %. Let represent the standard deviation of a stock's returns and r^ represent the expected returns of that stock. The formula for calculating the coefficient of variation for a stock's return is . Using this formula, along with your calculations in the previous For each row in the table, indicate the approximate value of the product of the probability multiplied by the squared difference between the rate of return and the expected rate of return for stock A. Using your answers from the f -U.Le bart of the question, the variance of the expected returns for stock A is approximately while the standard deviation of expected returns for stock A is approximately % Let represent the standard deviation of a stock's returns and r^ represent the expected returns of that stock. The formula for calculating the coefficient of variation for a stock's return is Using this formula, along with your calculations in the previous parts of the problem, the coefficient of variation of stock B is approximately Step 3: Practicet Expected Returns Now it's time for you to practice what you've learned. Consider the following two probability distributions of expected future returns for stocks A and B : For each row in the table, indicate the approximate value of the product of the probability multiplied by the squared difference between the rate retum and the expected rate of return for stock A. Using your answers from the previous part of the question, the variance of the expected returns for stock A is approximately while the standard deviation of expected returns for stock A is approximately %. Let represent the standard deviation of a stock's returns and r^ represent the expected returns of that stock. The formula for calculating the coefficient of variation for a stock's return is . Using this formula, along with your calcula 13.24 the previo parts of the problem, the coefficient of variation of stock B is approximately 4.3 Let represent the standard deviation of a stock's returns and r^ represent the expected returns of that stock. The formula for calculating the coefficient of variation for a stock's return is . Using this formula, along with your calculations in the previous parts of the problem, the coefficient of variation of stock B is approximately Consider the following two probability distributions of expected future returns for stocks A and B : Suppose you know that the expected rate of return for stock A is 9% and would like to calculate the expected return for stock B. The expected rate of return for stock B is approximately %. Suppose you know that the standard deviation of expected returns for stock B is 15.2602% and would like to calculate the standard deviation of Ch 08- Video Lesson - Risk and Rates of Return Suppose you know that the expected rate of return for stock A is 9% and would like to calculate the expected return for stock B. The expected rate of return for stock B is approximately %. Suppose you know that the standard deviation of expected retums for stock B is 15.2602% and would like to calculate the standard deviation of expected returns for stock A. Hint: Recall that the expected rate of return for stock A is 9%. The variance of the expected returns for stock A is approximately while the standard deviation of expected returns for stock A is approximately % Using your calculations in the previous parts of the problem, the coefficient of variation of stock B is approximately True or Faise: Investors will always view the stock with a lower coefficient of variation as a "safer" choice when compared to a stock with a higher coefficient of variation. True
Step by Step Solution
There are 3 Steps involved in it

Get step-by-step solutions from verified subject matter experts