

Question: Dry Lab for Standard Line Plot Graphing and Beer's Law H E L P ! Make a standard line plot (line of best fit) on
Dry Lab for Standard Line Plot Graphing and Beer's Law
H E L P !
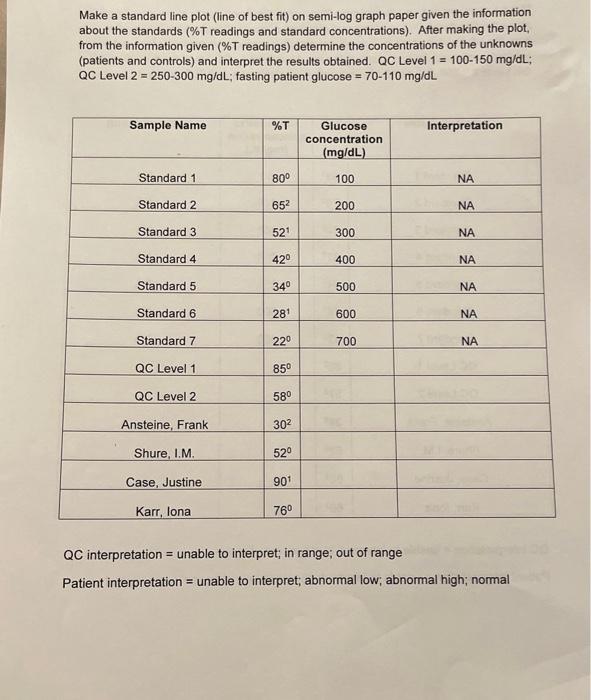
Make a standard line plot (line of best fit) on semi-log graph paper given the information about the standards (\%T readings and standard concentrations). After making the plot. from the information given ( %T readings) determine the concentrations of the unknowns (patients and controls) and interpret the results obtained. QC Level 1=100150mg/dL; QC Level 2=250300mg/dL; fasting patient glucose =70110mg/dL QC interpretation = unable to interpret; in range; out of range Patient interpretation = unable to interpret; abnormal low; abnormal high; normal
Step by Step Solution
There are 3 Steps involved in it
1 Expert Approved Answer
Step: 1 Unlock

Question Has Been Solved by an Expert!
Get step-by-step solutions from verified subject matter experts
Step: 2 Unlock
Step: 3 Unlock