

Question: Due Date: Mart 2 5 , 2 0 2 4 Consider the following continuously operating job shop. Interarrival times of jobs are distributed as follows:
Due Date: Mart
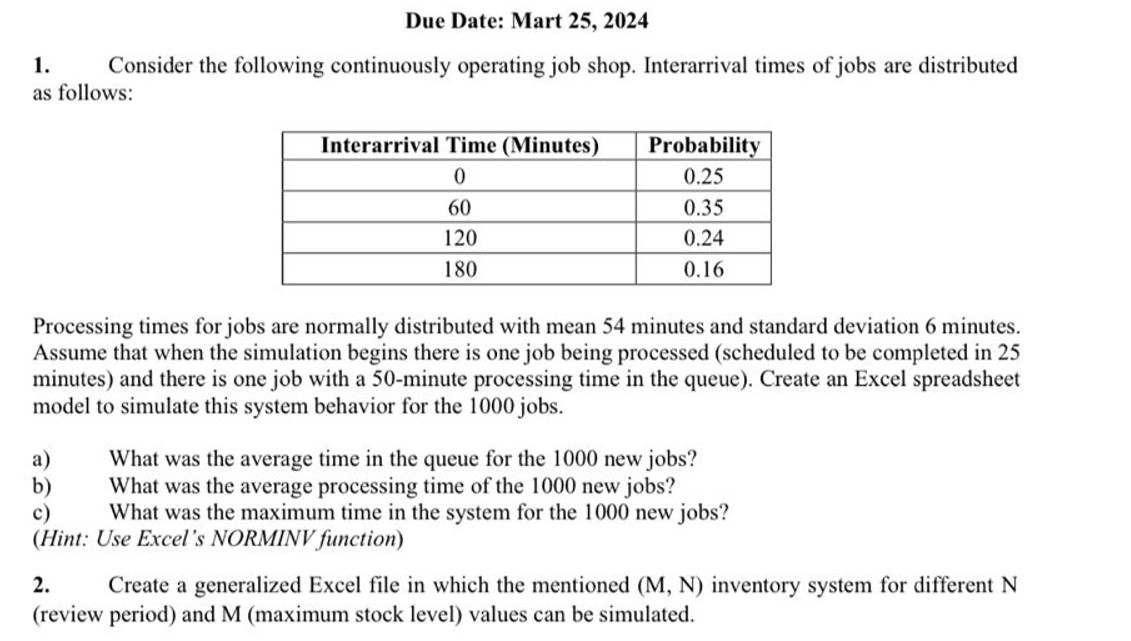
Consider the following continuously operating job shop. Interarrival times of jobs are distributed
as follows:
Processing times for jobs are normally distributed with mean minutes and standard deviation minutes.
Assume that when the simulation begins there is one job being processed scheduled to be completed in
minutes and there is one job with a minute processing time in the queue Create an Excel spreadsheet
model to simulate this system behavior for the jobs.
a What was the average time in the queue for the new jobs?
b What was the average processing time of the new jobs?
c What was the maximum time in the system for the new jobs?
Hint: Use Excel's NORMINV function
Create a generalized Excel file in which the mentioned inventory system for different
review period and M maximum stock level values can be simulated.
Step by Step Solution
There are 3 Steps involved in it
1 Expert Approved Answer
Step: 1 Unlock

Question Has Been Solved by an Expert!
Get step-by-step solutions from verified subject matter experts
Step: 2 Unlock
Step: 3 Unlock