

Question: DUE DATE: Week 15 - - Given the training data in the below table (Buy Computer data) RID age income student credit_rating Class: buys_computer 1
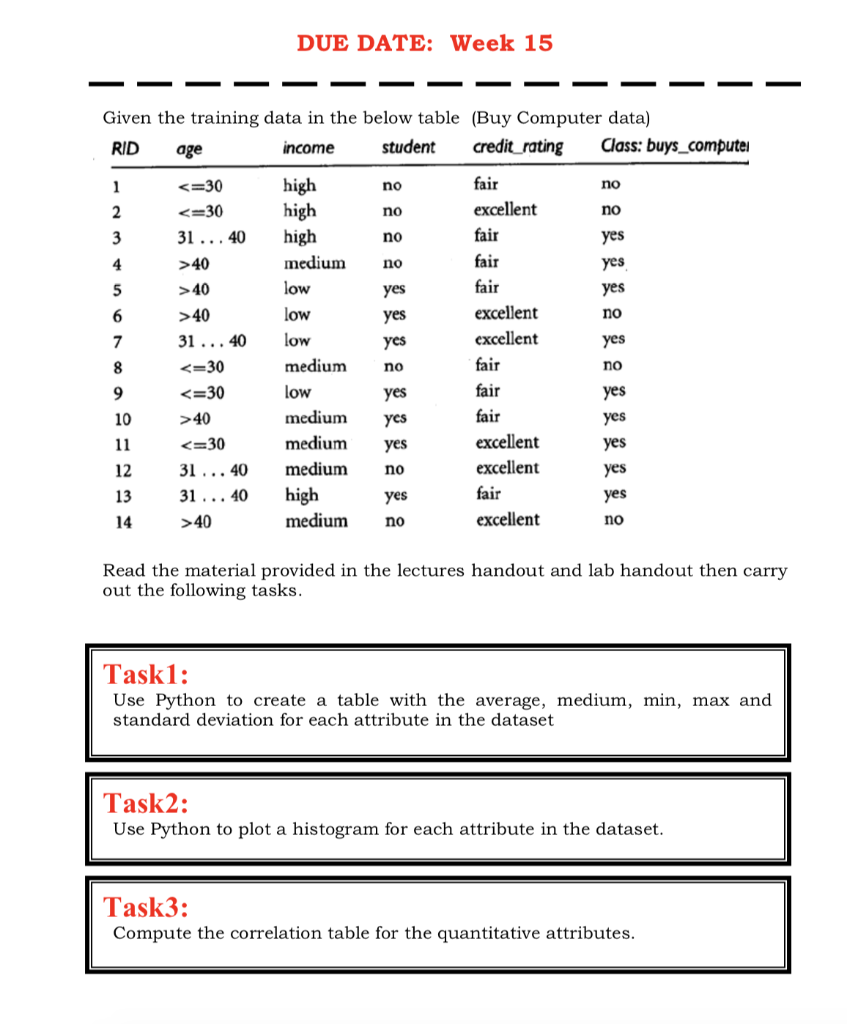

DUE DATE: Week 15 - - Given the training data in the below table (Buy Computer data) RID age income student credit_rating Class: buys_computer 1 no no 2 no no 3 no 4 no 40 > 40 > 40 31 ... 40 40 yes yes yes no 5 6 yes yes yes no 7 high high high medium low low low medium low medium medium medium high medium yes fair excellent fair fair fair excellent excellent fair fair fair excellent excellent fair excellent no 8 9 10 yes yes yes yes yes yes 11 40 yes yes 13 yes 14 no no Read the material provided in the lectures handout and lab handout then carry out the following tasks. Taski: Use Python to create a table with the average, medium, min, max and standard deviation for each attribute in the dataset Task2: Use Python to plot a histogram for each attribute in the dataset. Task3: Compute the correlation table for the quantitative attributes. Task4: Build a decision tree to the above dataset using all the relevant predictors. Find the model by using the following method: An entropy measure (pen and paper) Pyhton code
Step by Step Solution
There are 3 Steps involved in it

Get step-by-step solutions from verified subject matter experts