

Question: DUE DATE: Week 15 Read the material provided in the lectures handout and lab handout then carry out the following tasks. Task1: Use Python to
- DUE DATE: Week 15 Read the material provided in the lectures handout and lab handout then carry out the following tasks.
- Task1: Use Python to create a table with the average, median, min, max, and standard deviation for each attribute in the dataset
- Task2: Use Python to plot a histogram for each attribute in the dataset.
- Task3: Compute the correlation table for the quantitative attributes.
- Task4: Build a decision tree to the above dataset using all the relevant predictors. Find the model by using the following method: • An entropy measure ( pen and paper) • Python code.
- Task5: Use the created Mode in Task 4 to Predict the class of the following new example: age_=30, income=medium, student=yes, credit-rating=fair. Each small group of students will prepare a report which provides solutions to the above tasks while the main outline of the reports is. 1.0 Introduction Create the “Introduction” section of the project plan including; 1.1 project name, 1.2 reference materials, 1.3 lists of definitions and acronyms (if appropriate) 2.0 Tasks Solution with their interpretation. 3.0 Conclusion
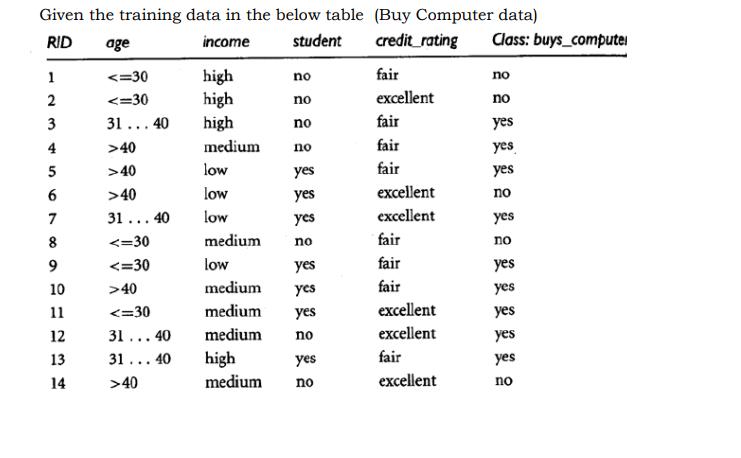
Given the training data in the below table (Buy Computer data) RID age income student 1 2 3 4 5 6 7 8 9 10 11 12 13 34 14 40 >40 31 ... 40
Step by Step Solution
★★★★★
3.45 Rating (152 Votes )
There are 3 Steps involved in it
1 Expert Approved Answer
Step: 1 Unlock

DUE DATE Week 15 Read the material provided in the lectures handout and lab handout then carry out t... View full answer
Question Has Been Solved by an Expert!
Get step-by-step solutions from verified subject matter experts
Step: 2 Unlock
Step: 3 Unlock